Century 21 People’s Choice Realty Inc., Brokerage
120 MATHESON BLVD E #103
MISSISSAUGA, Ontario
L4Z 1X1
Toronto, South Riverdale, M4M 2S3
$1,298,000
Listed by RE/MAX ELITE REAL ESTATE.
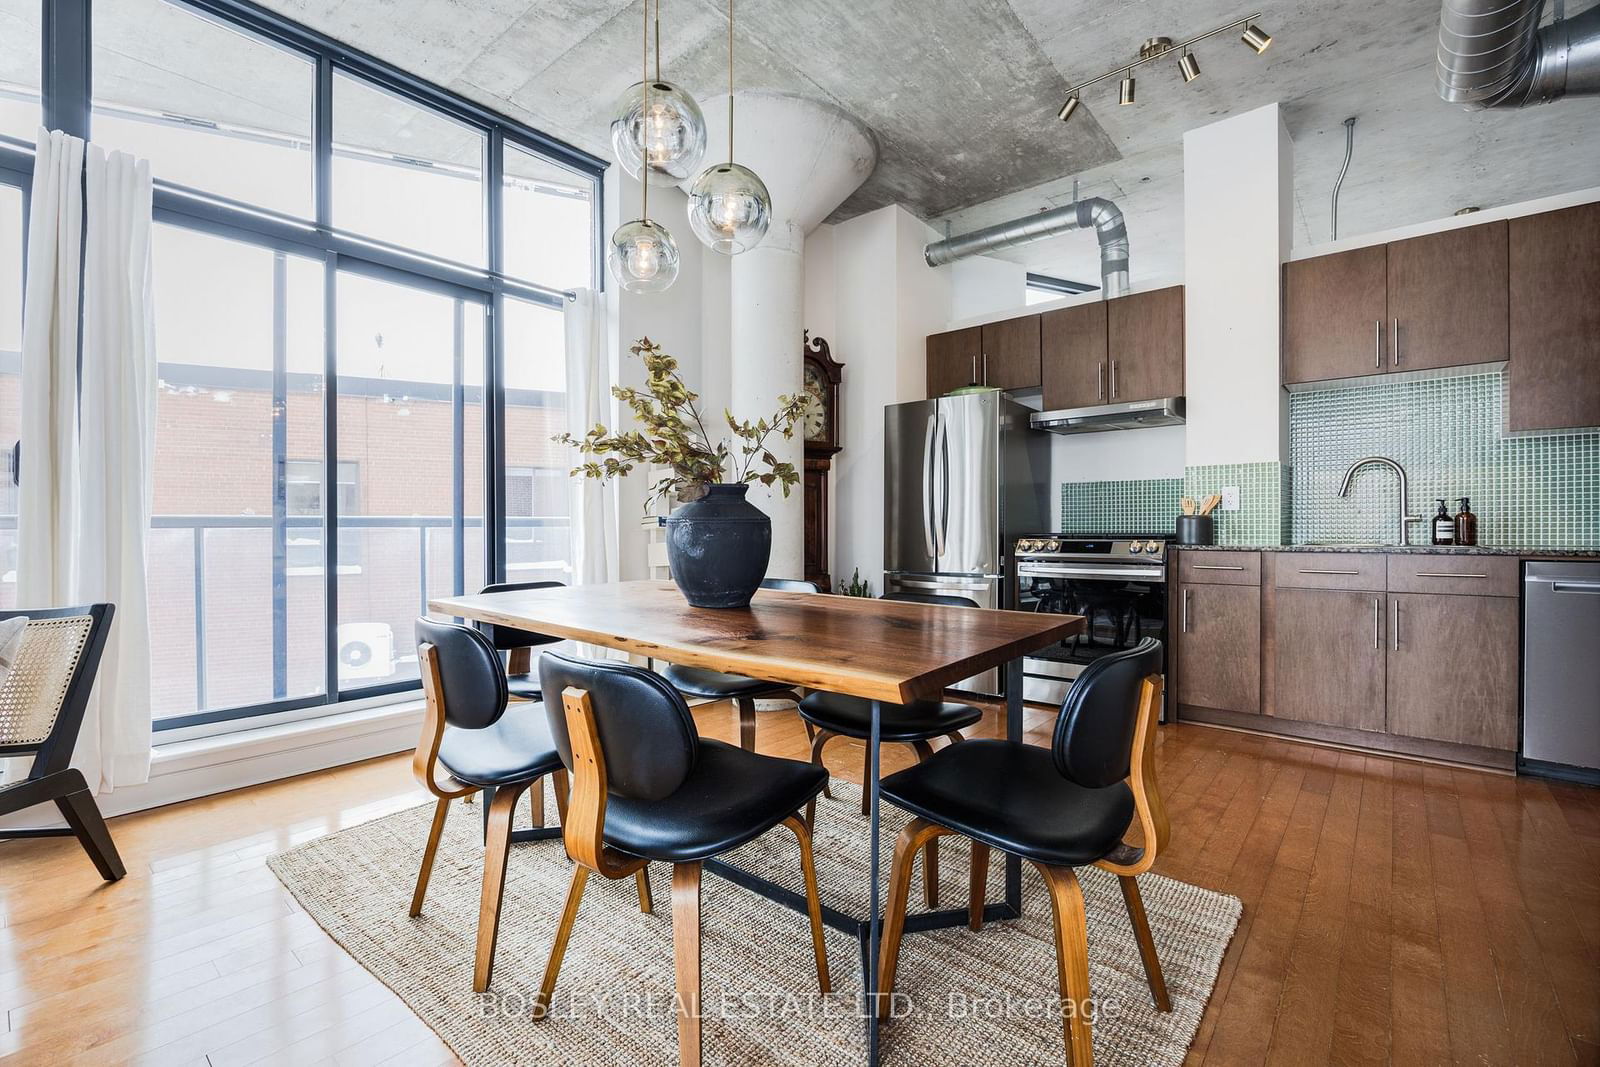
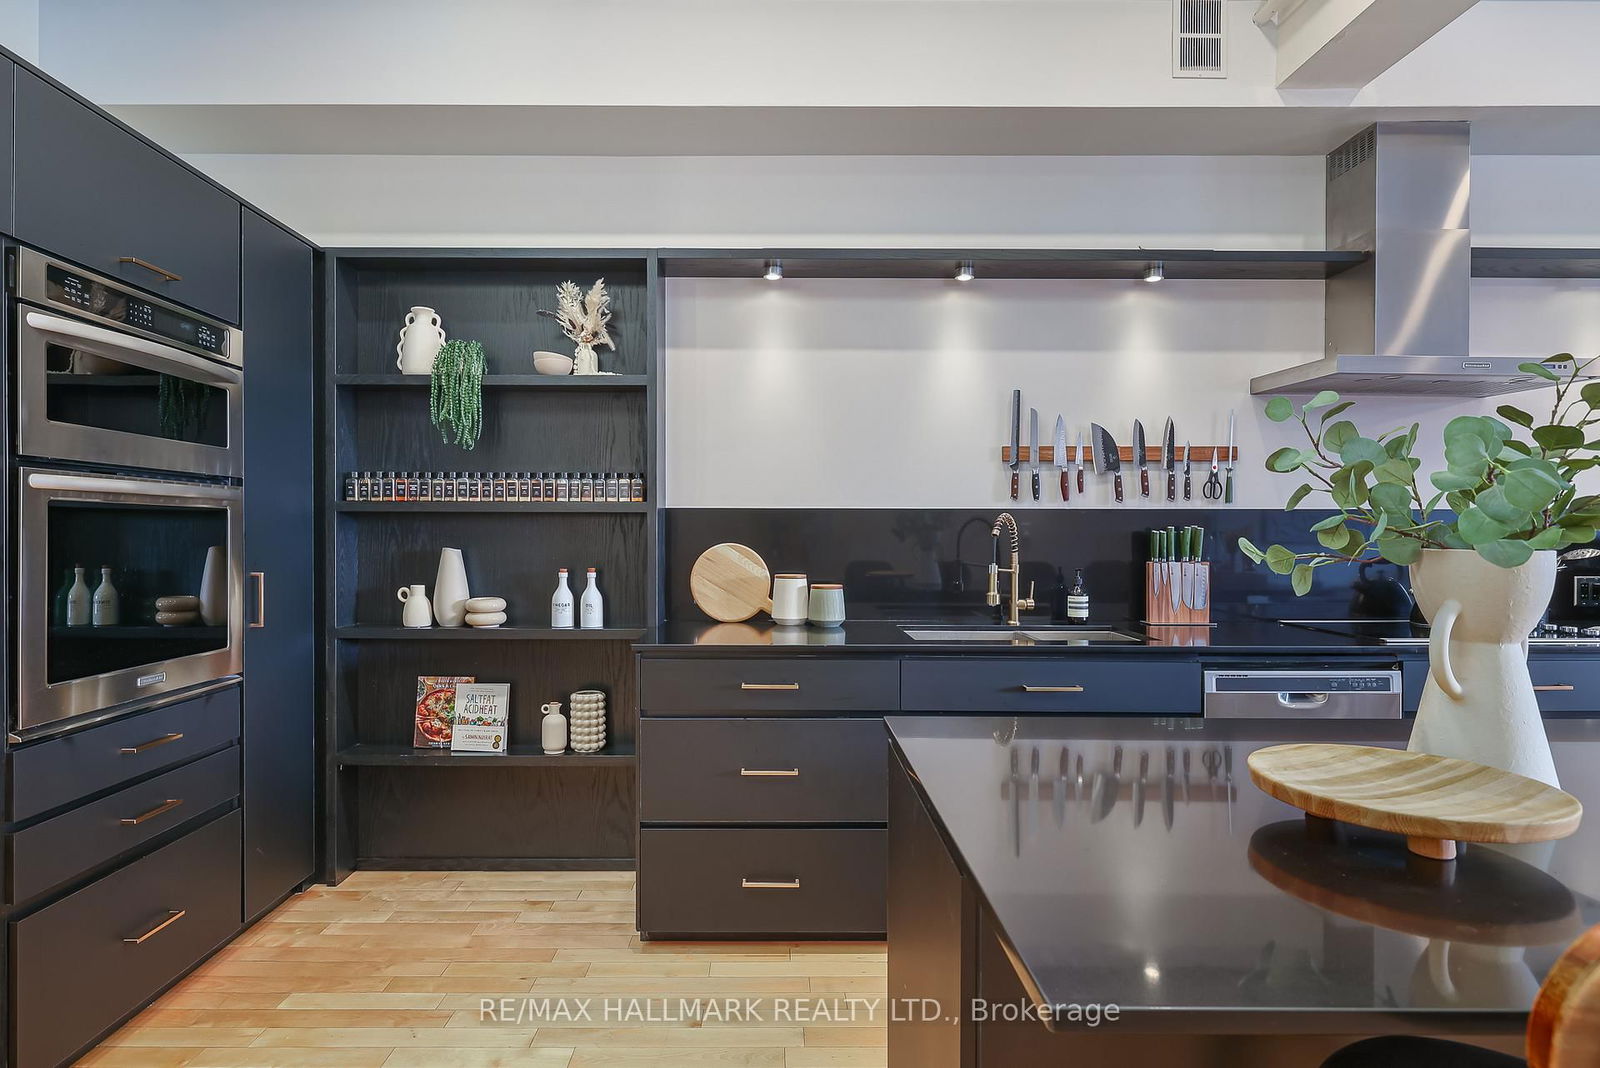
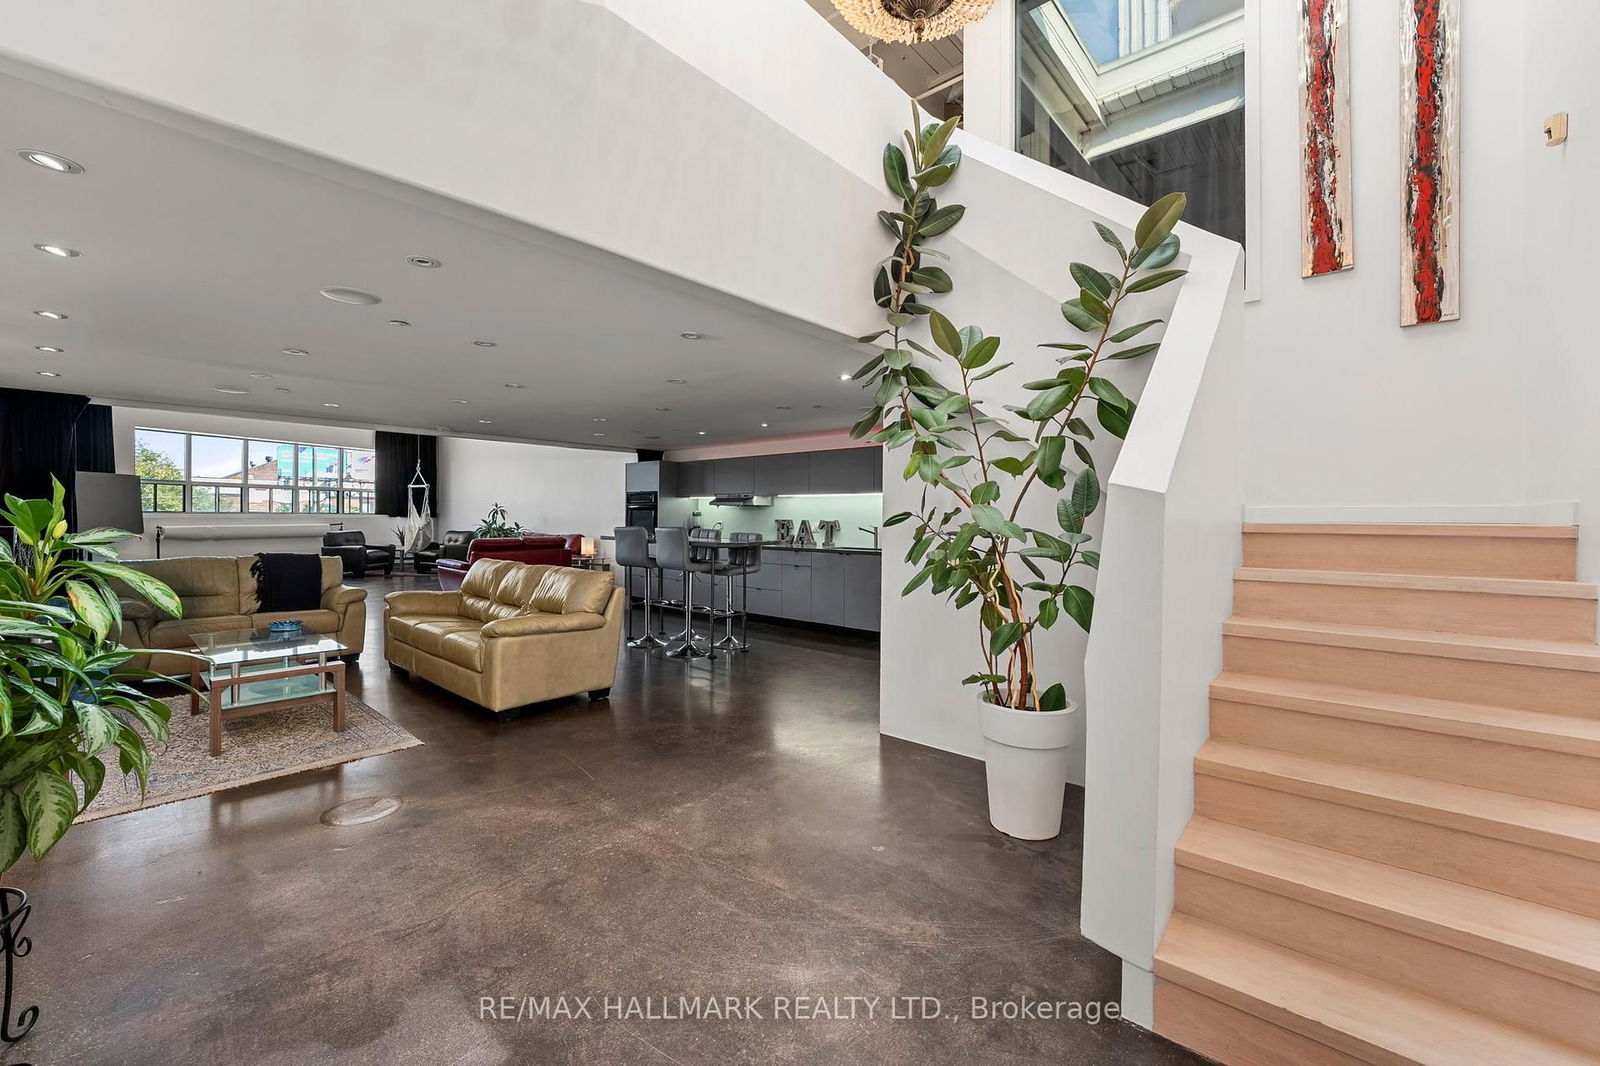
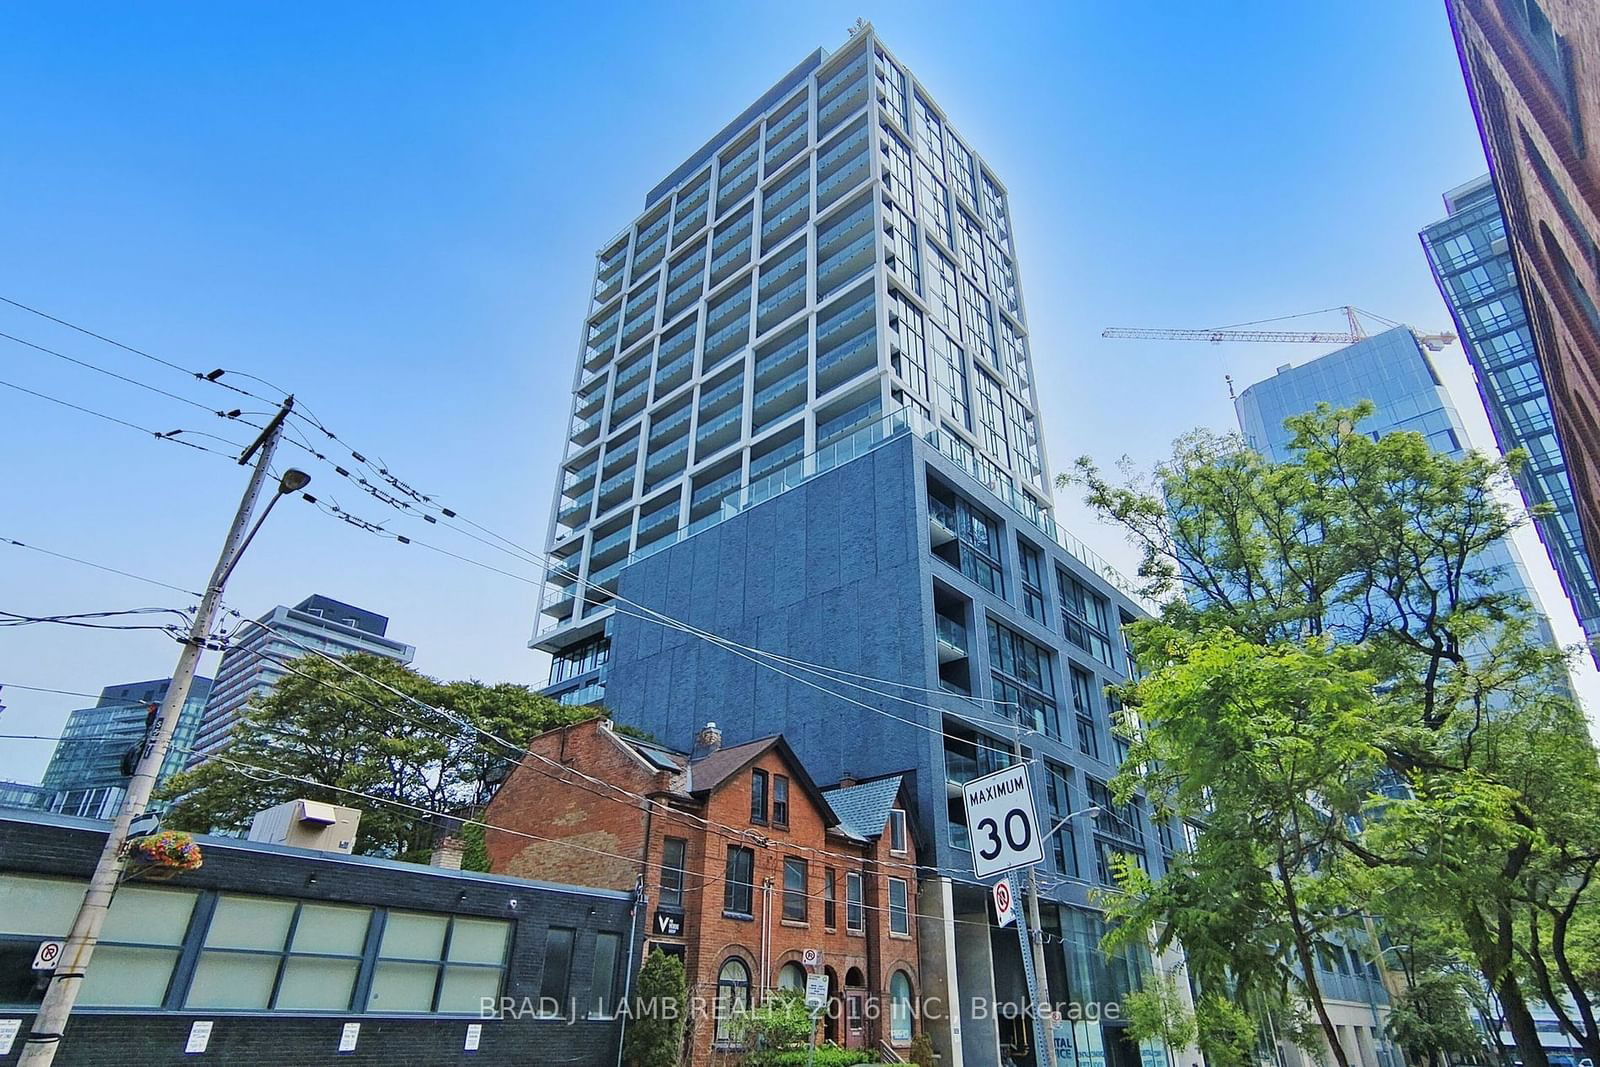
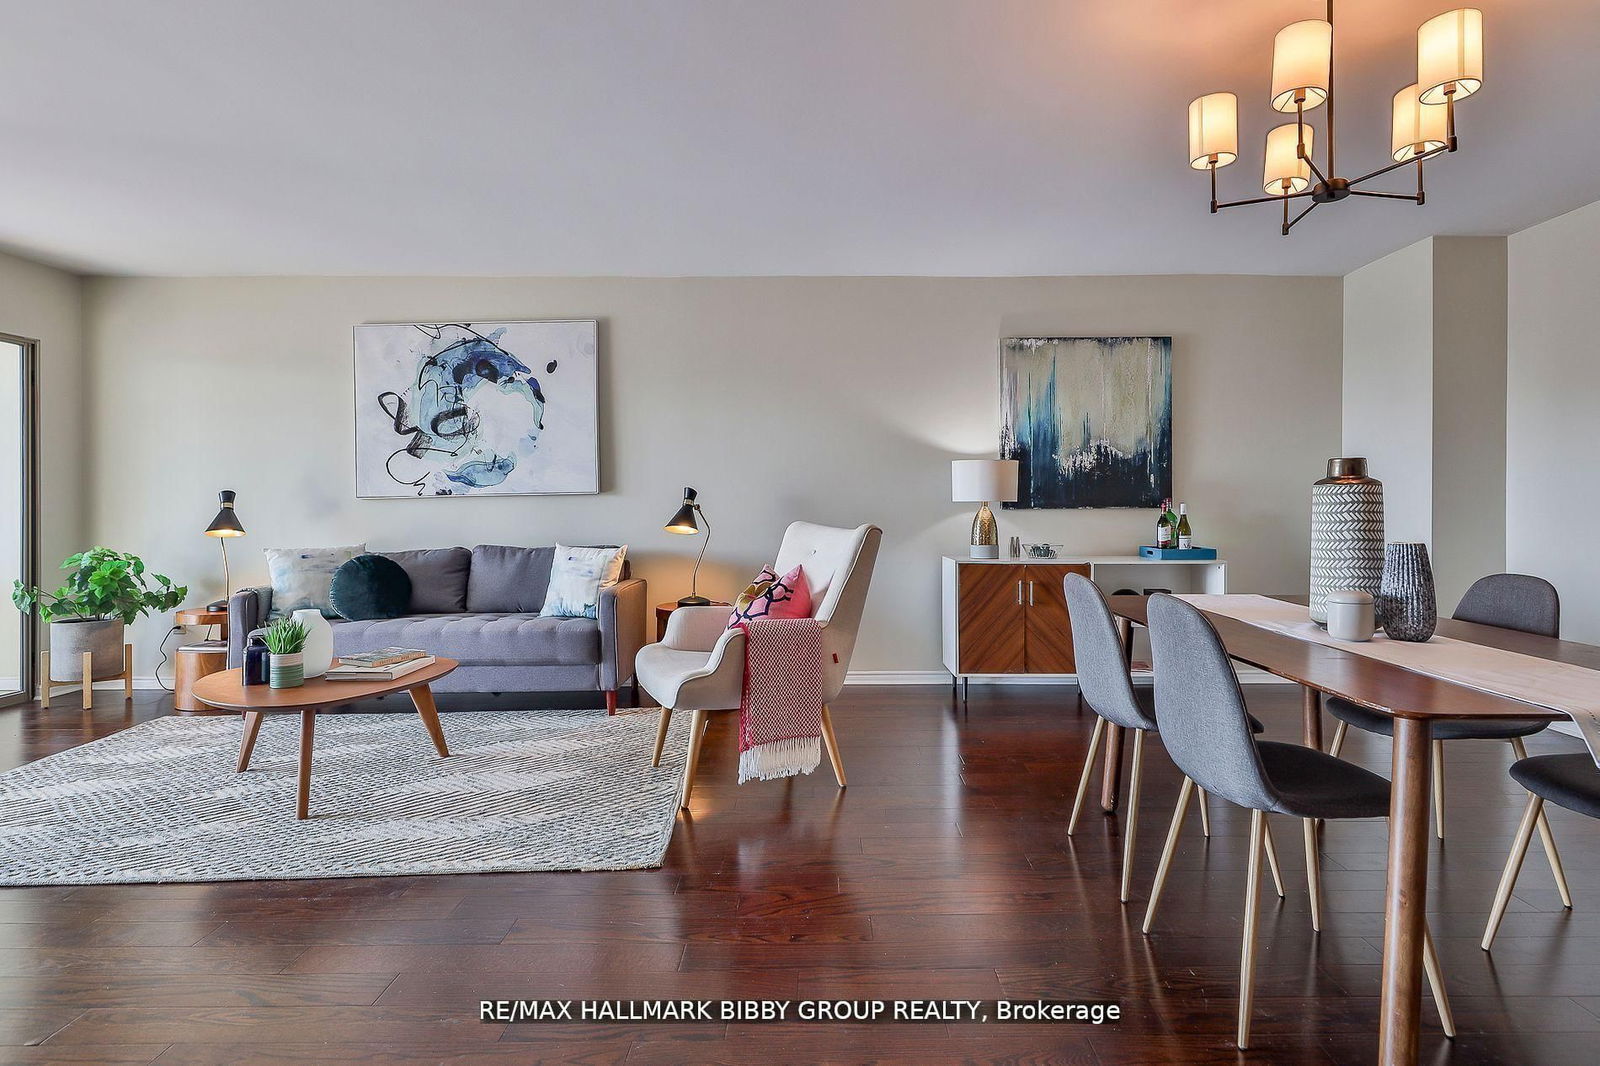
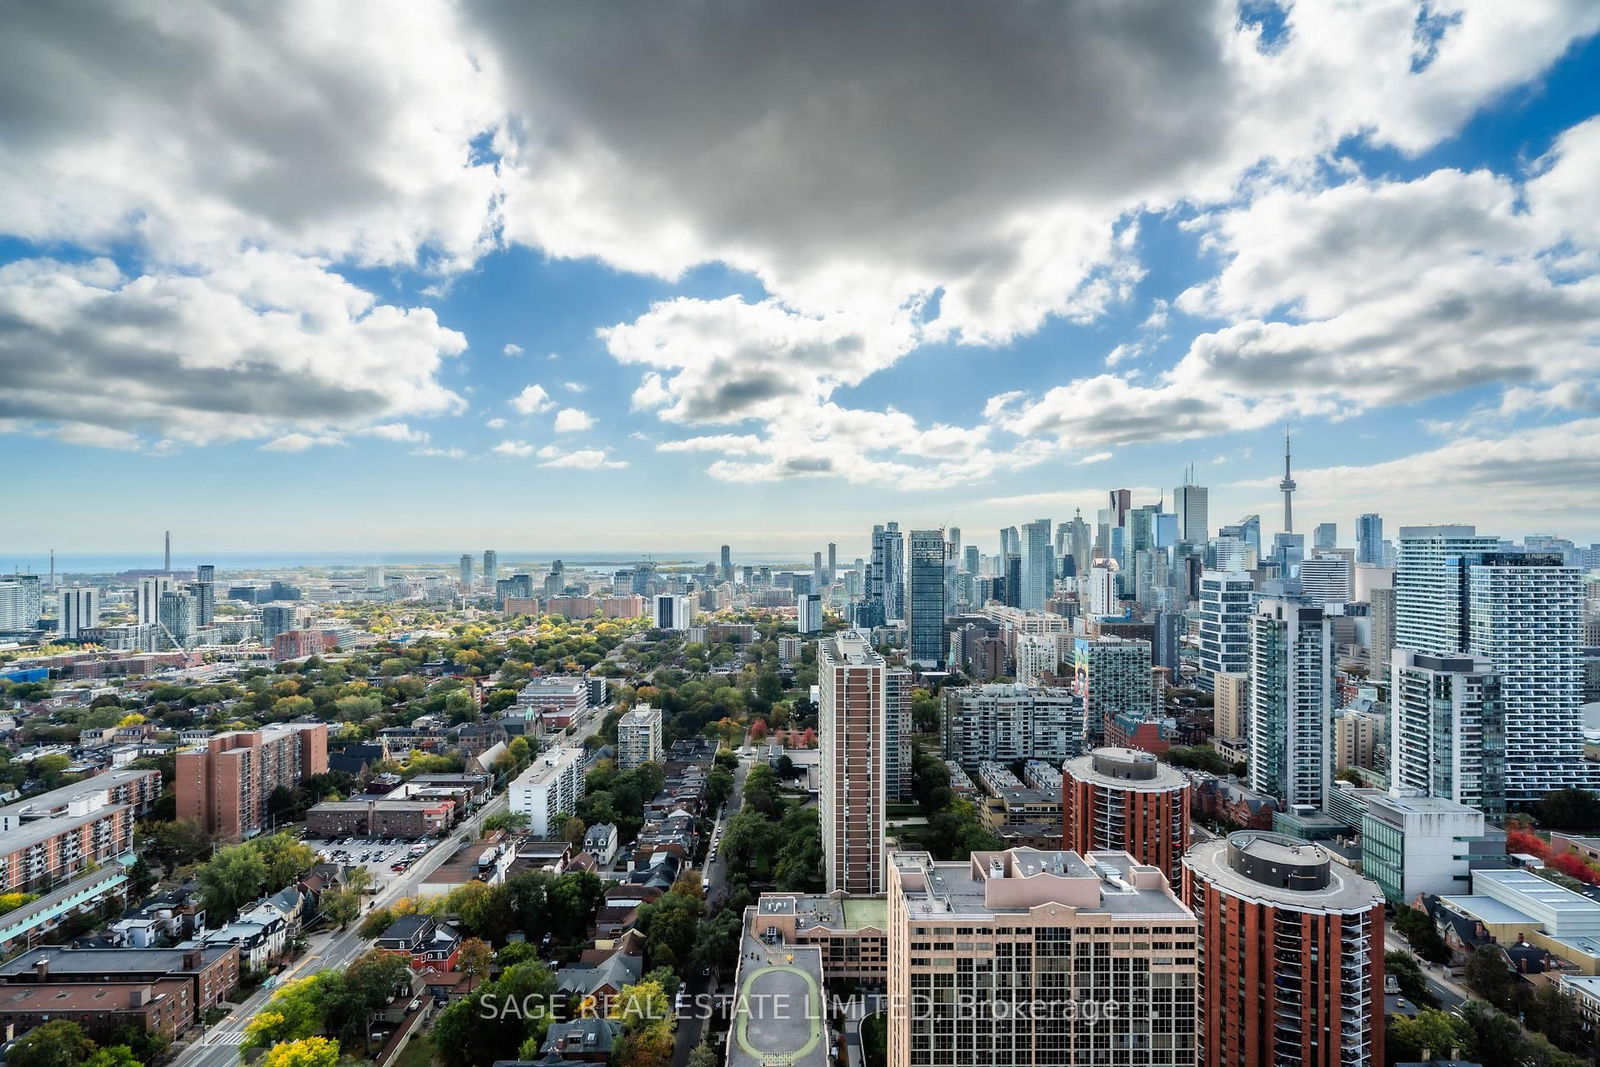
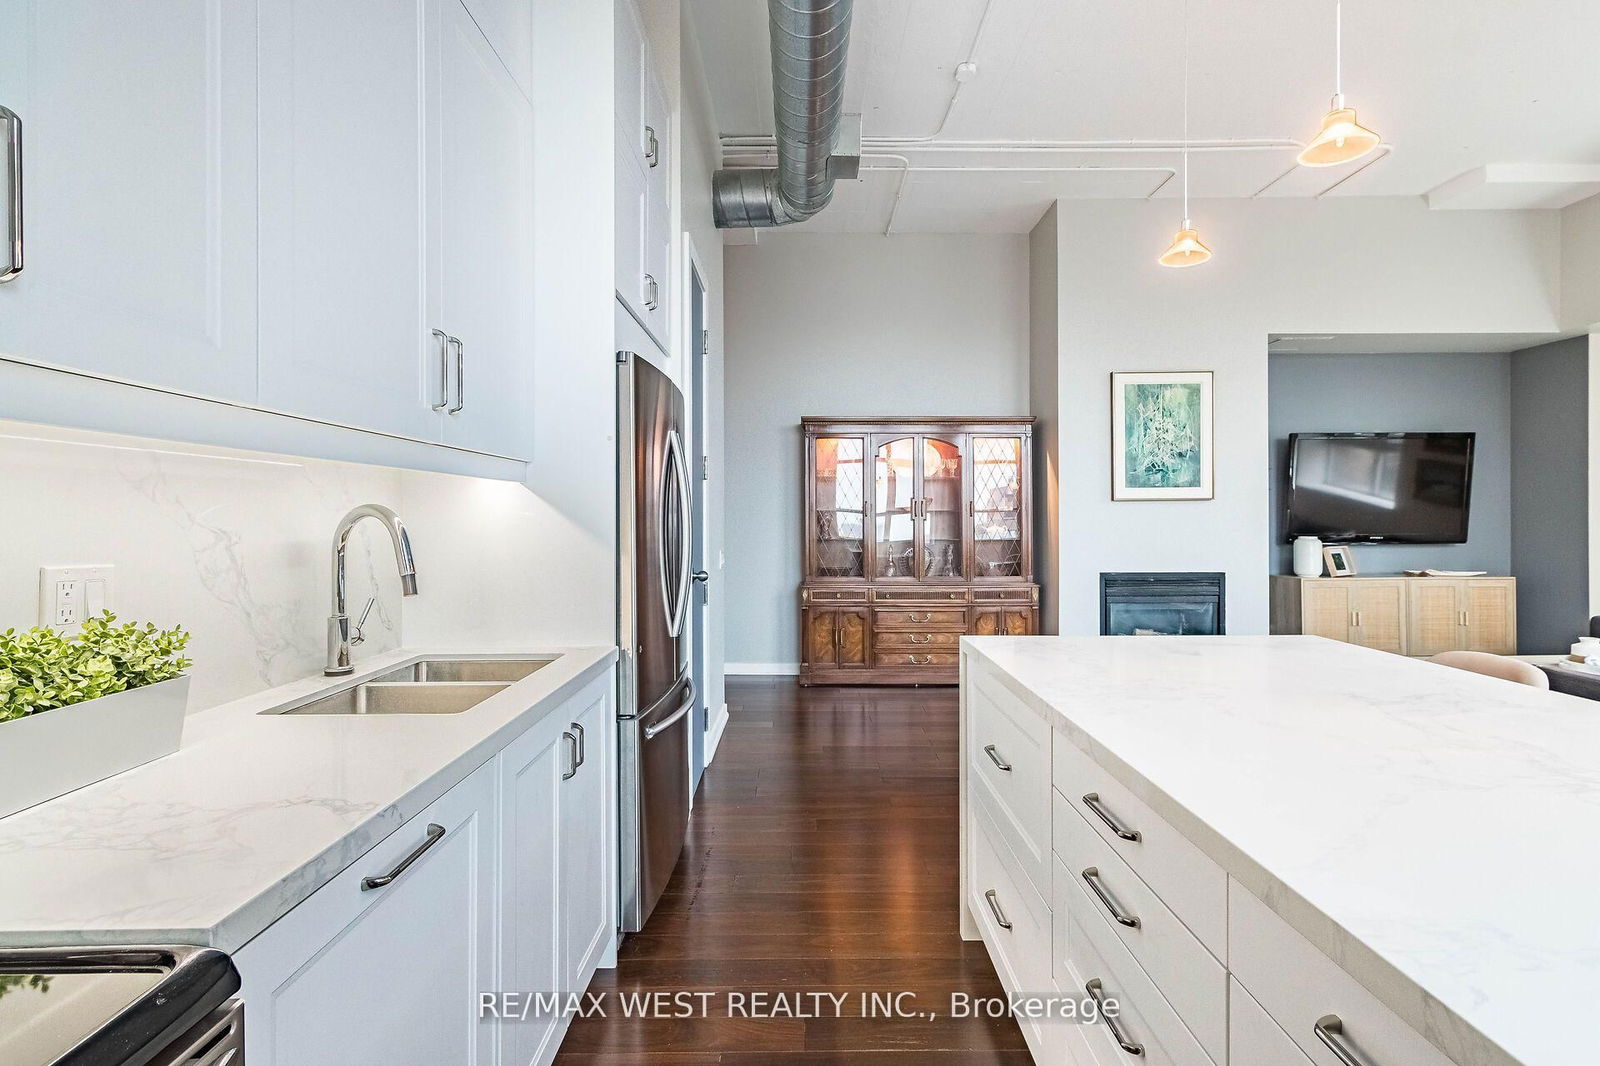
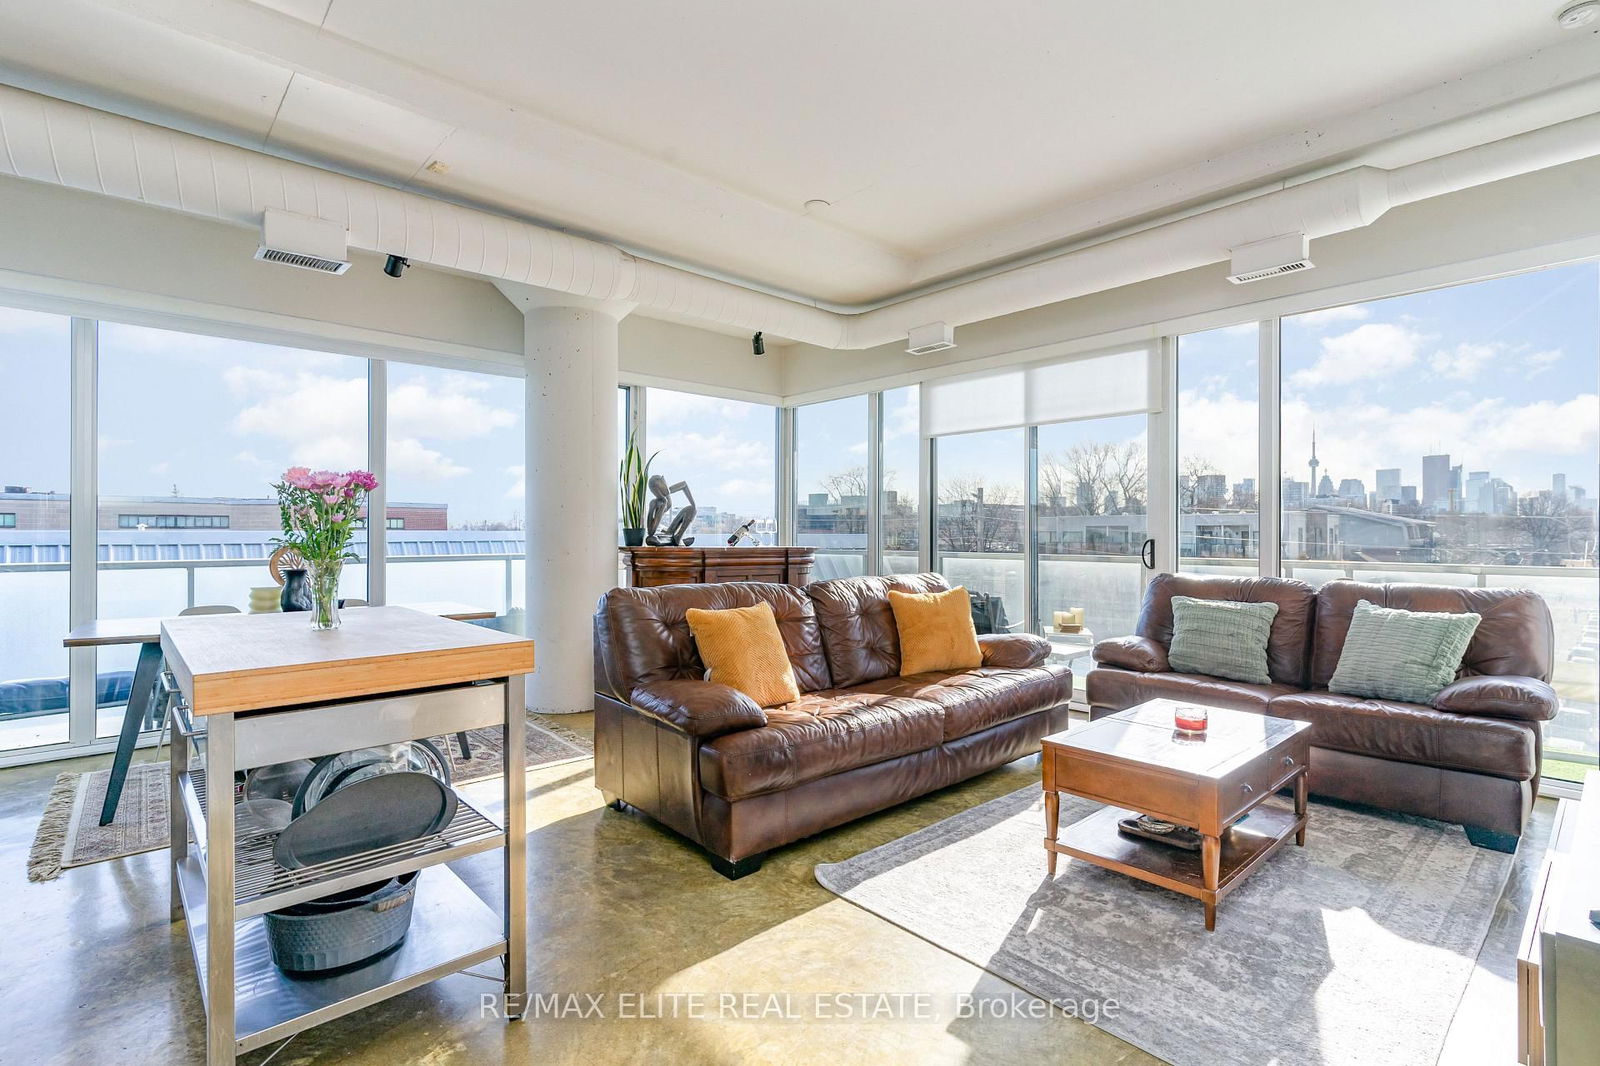
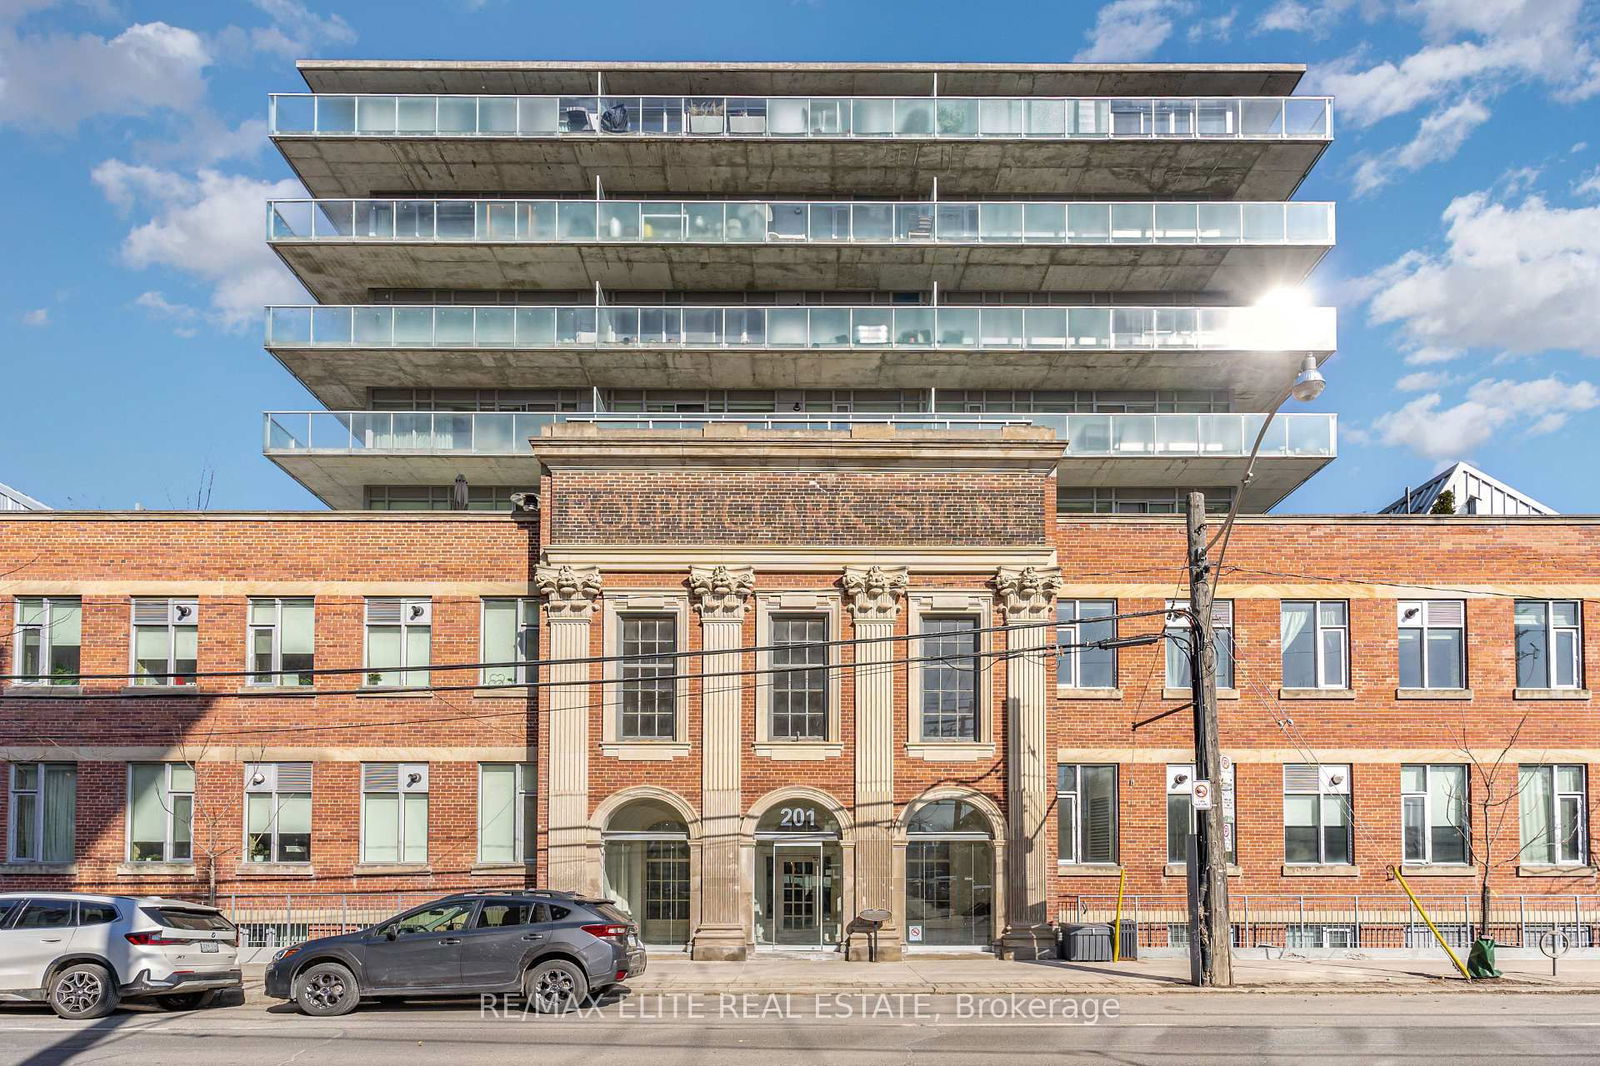
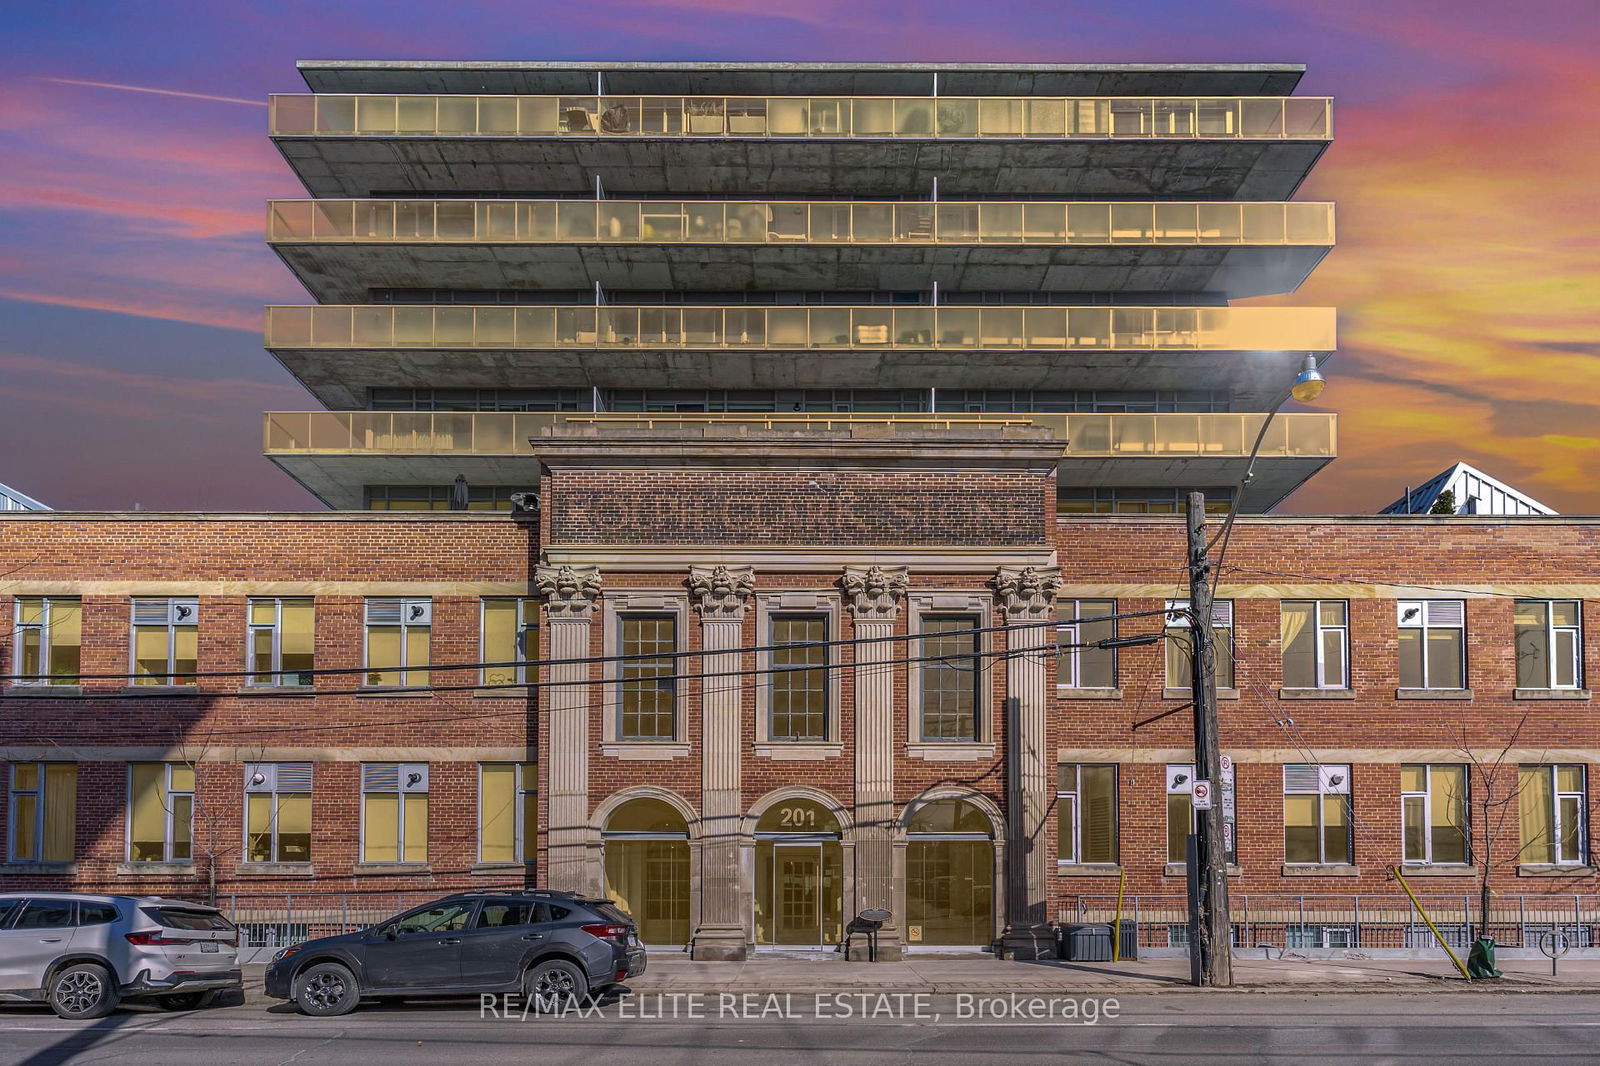
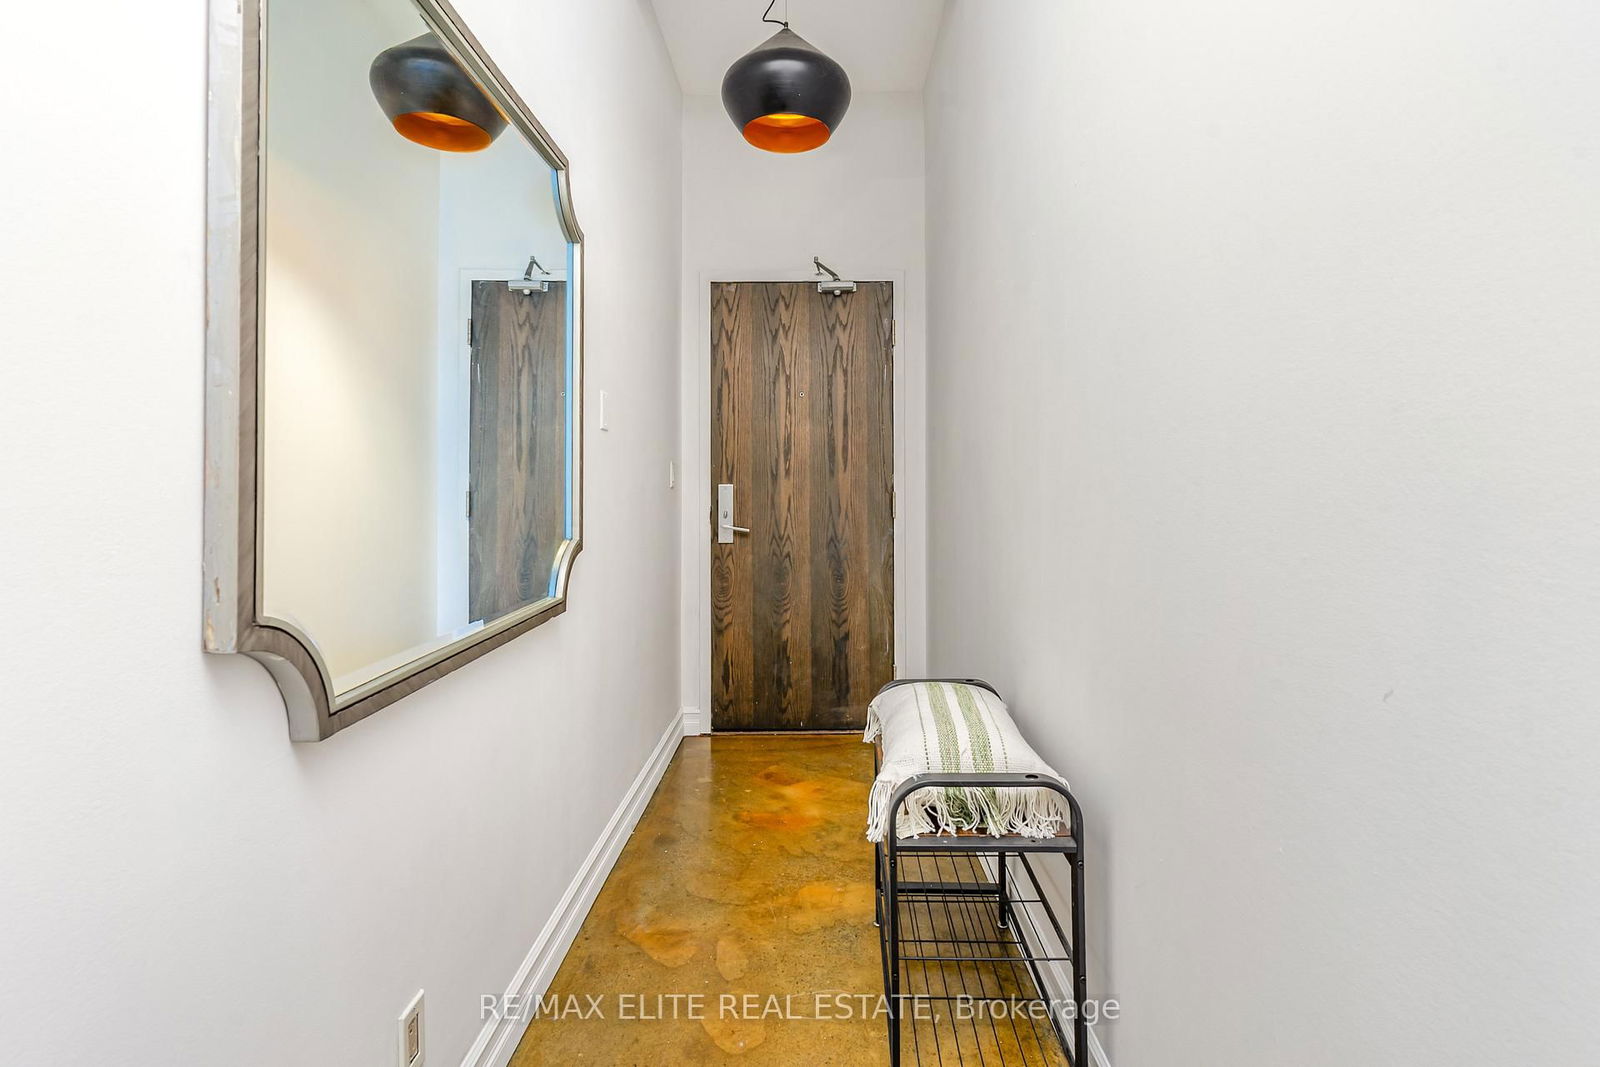
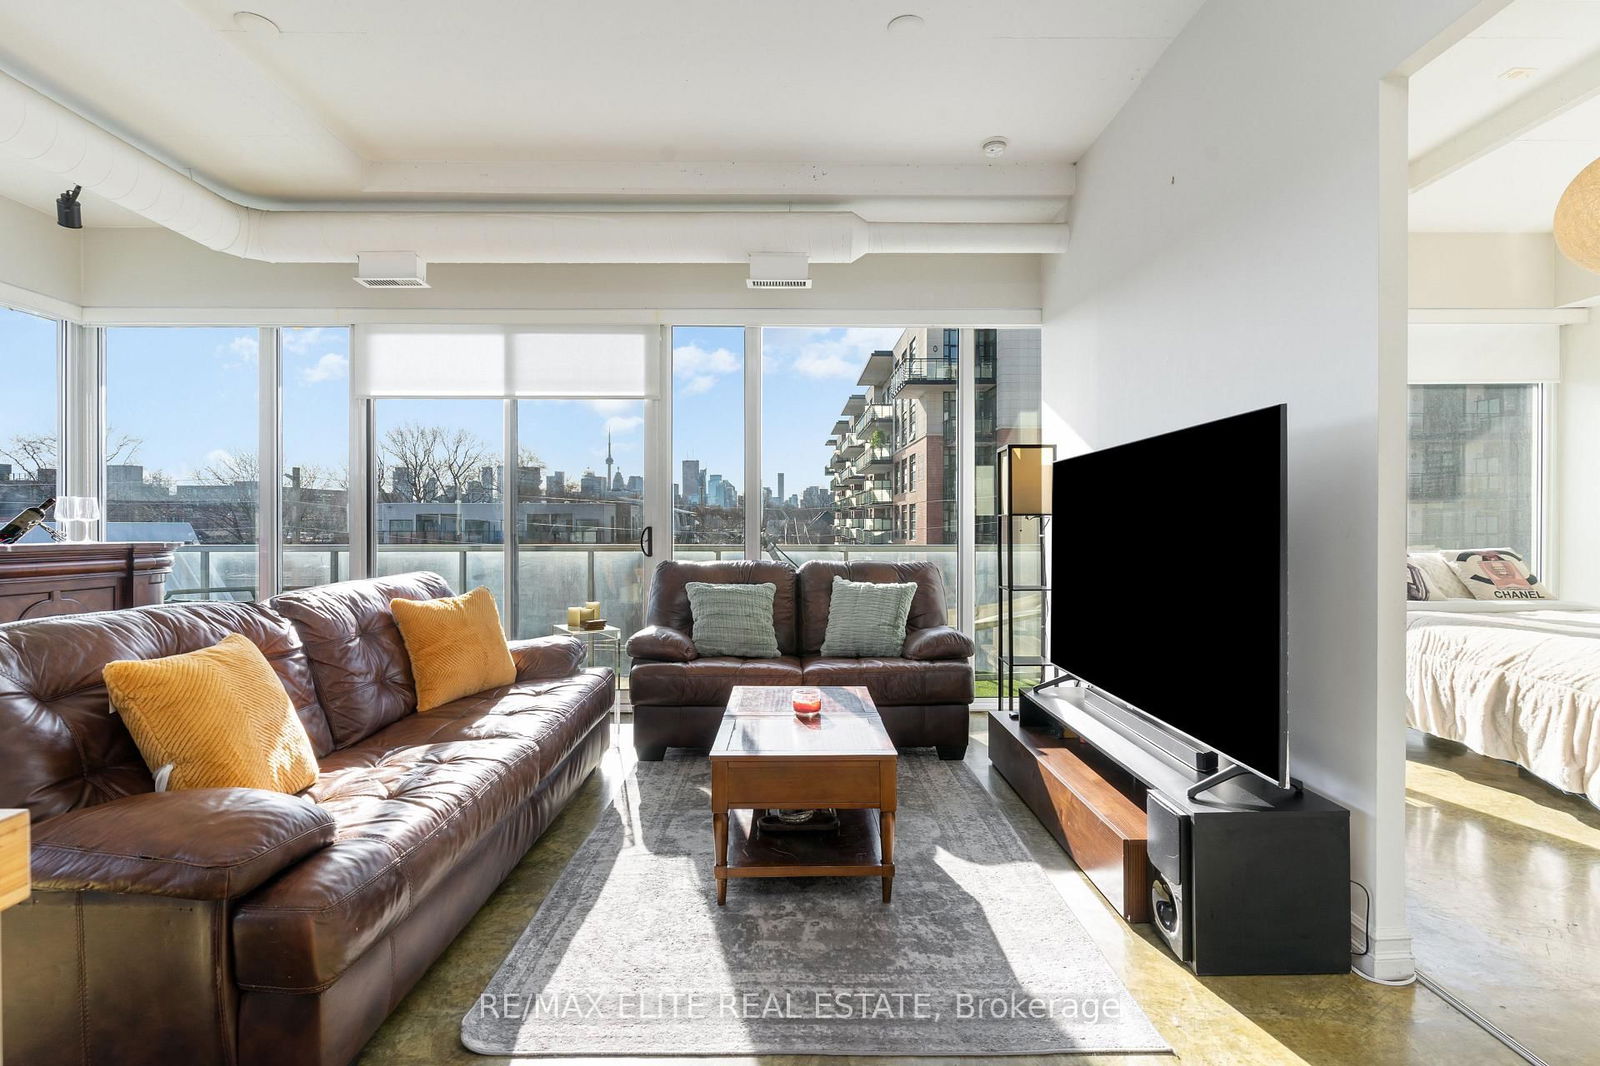
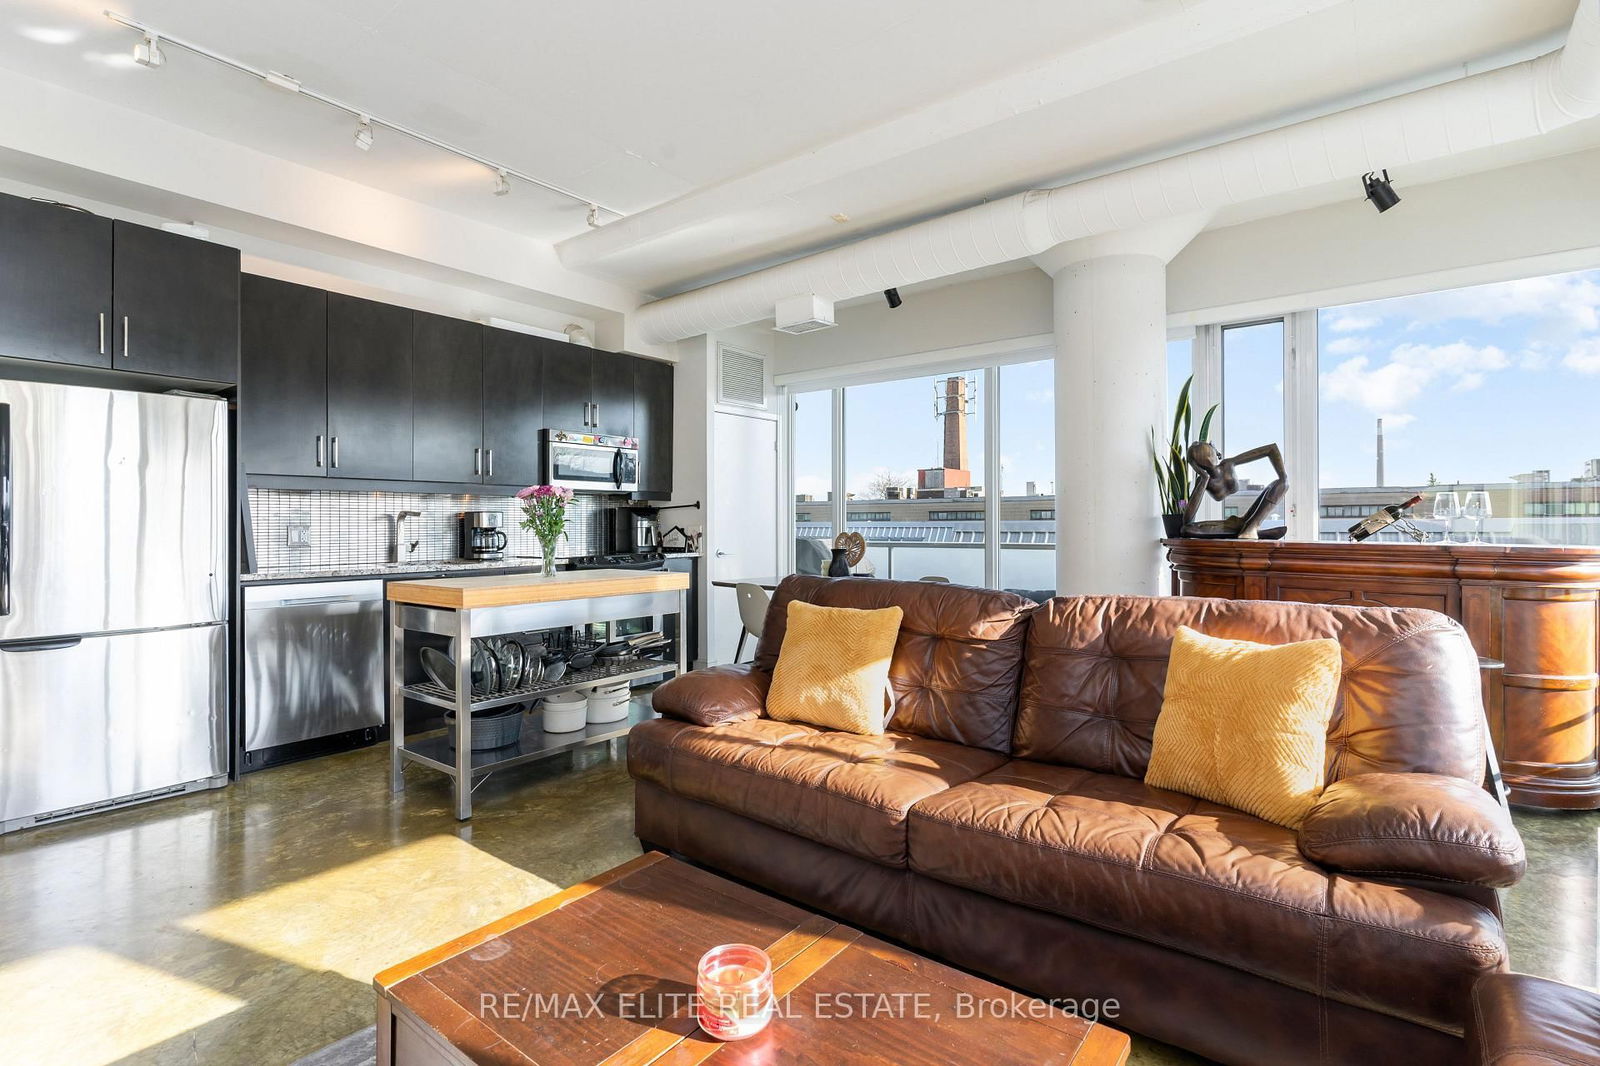
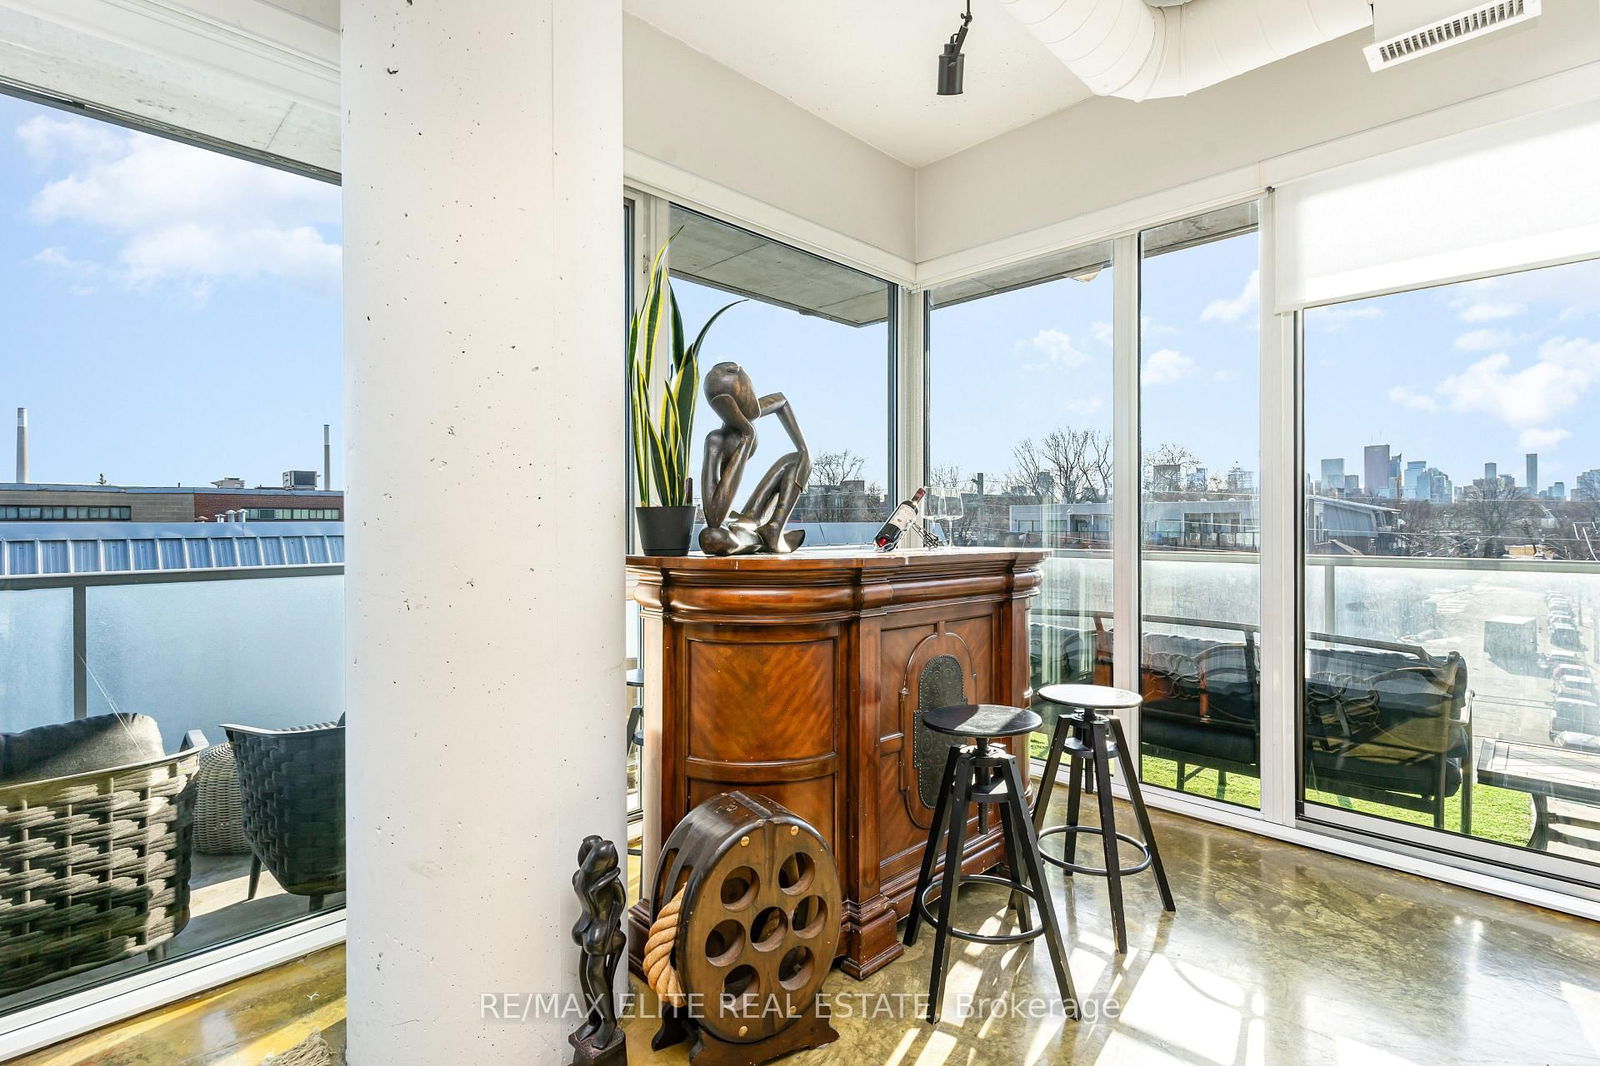
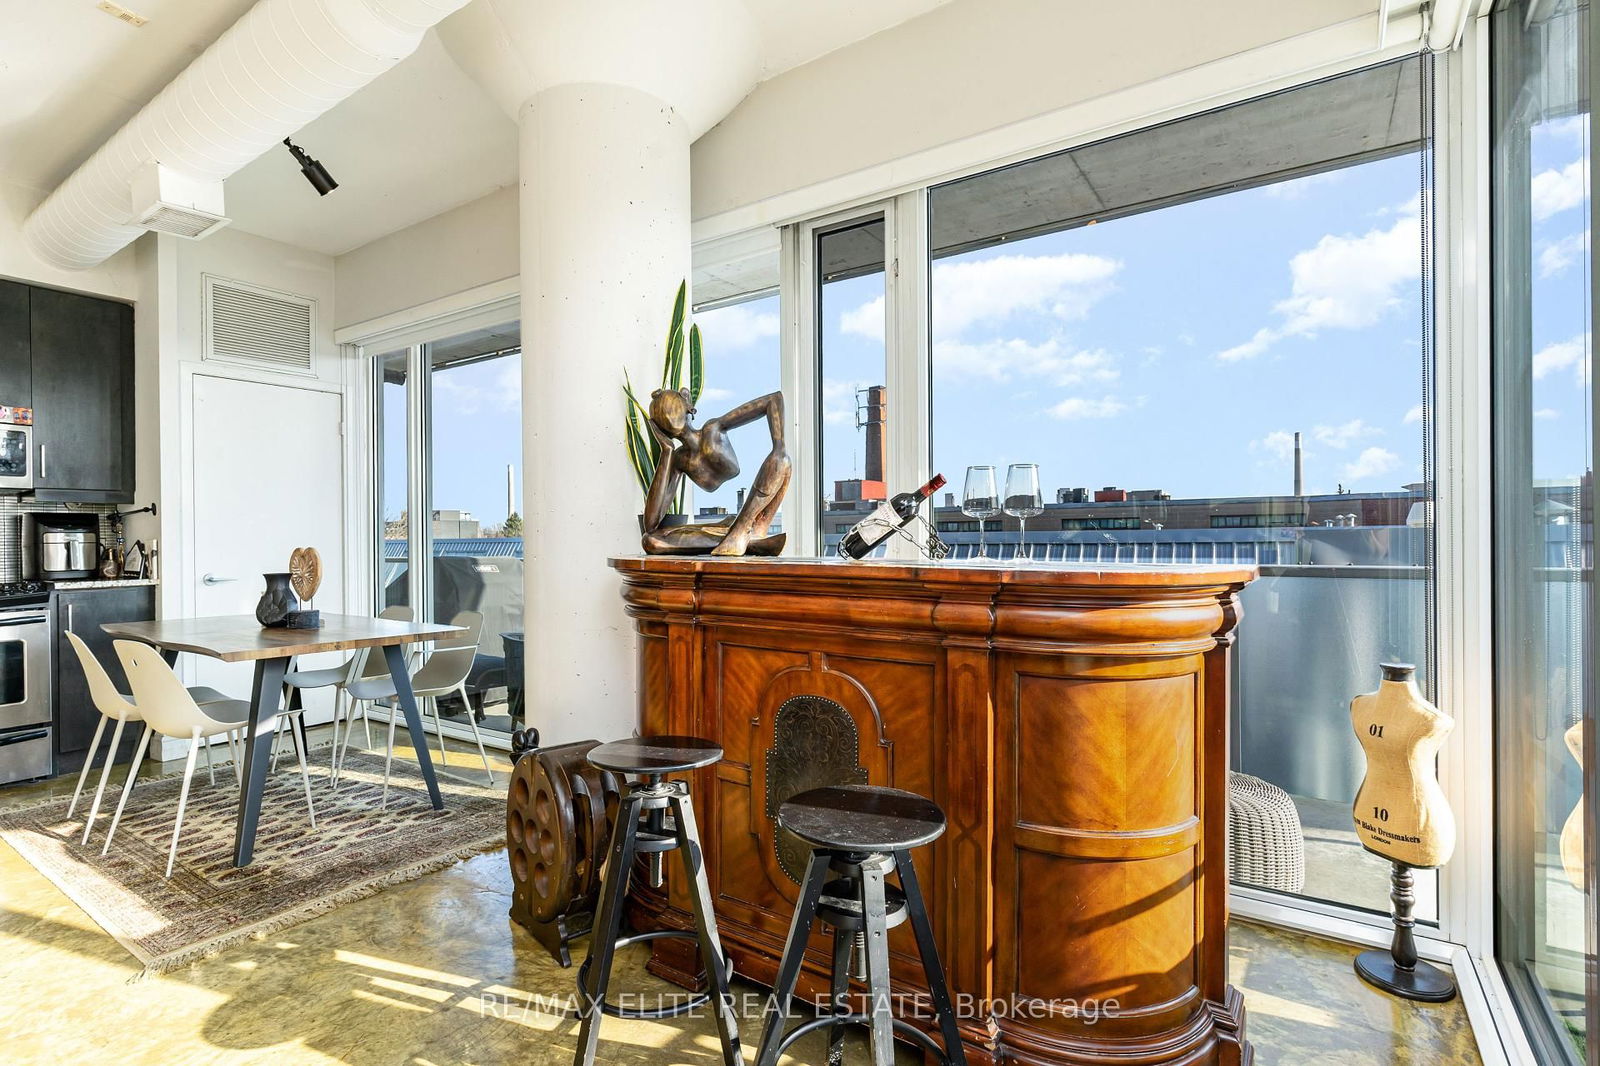
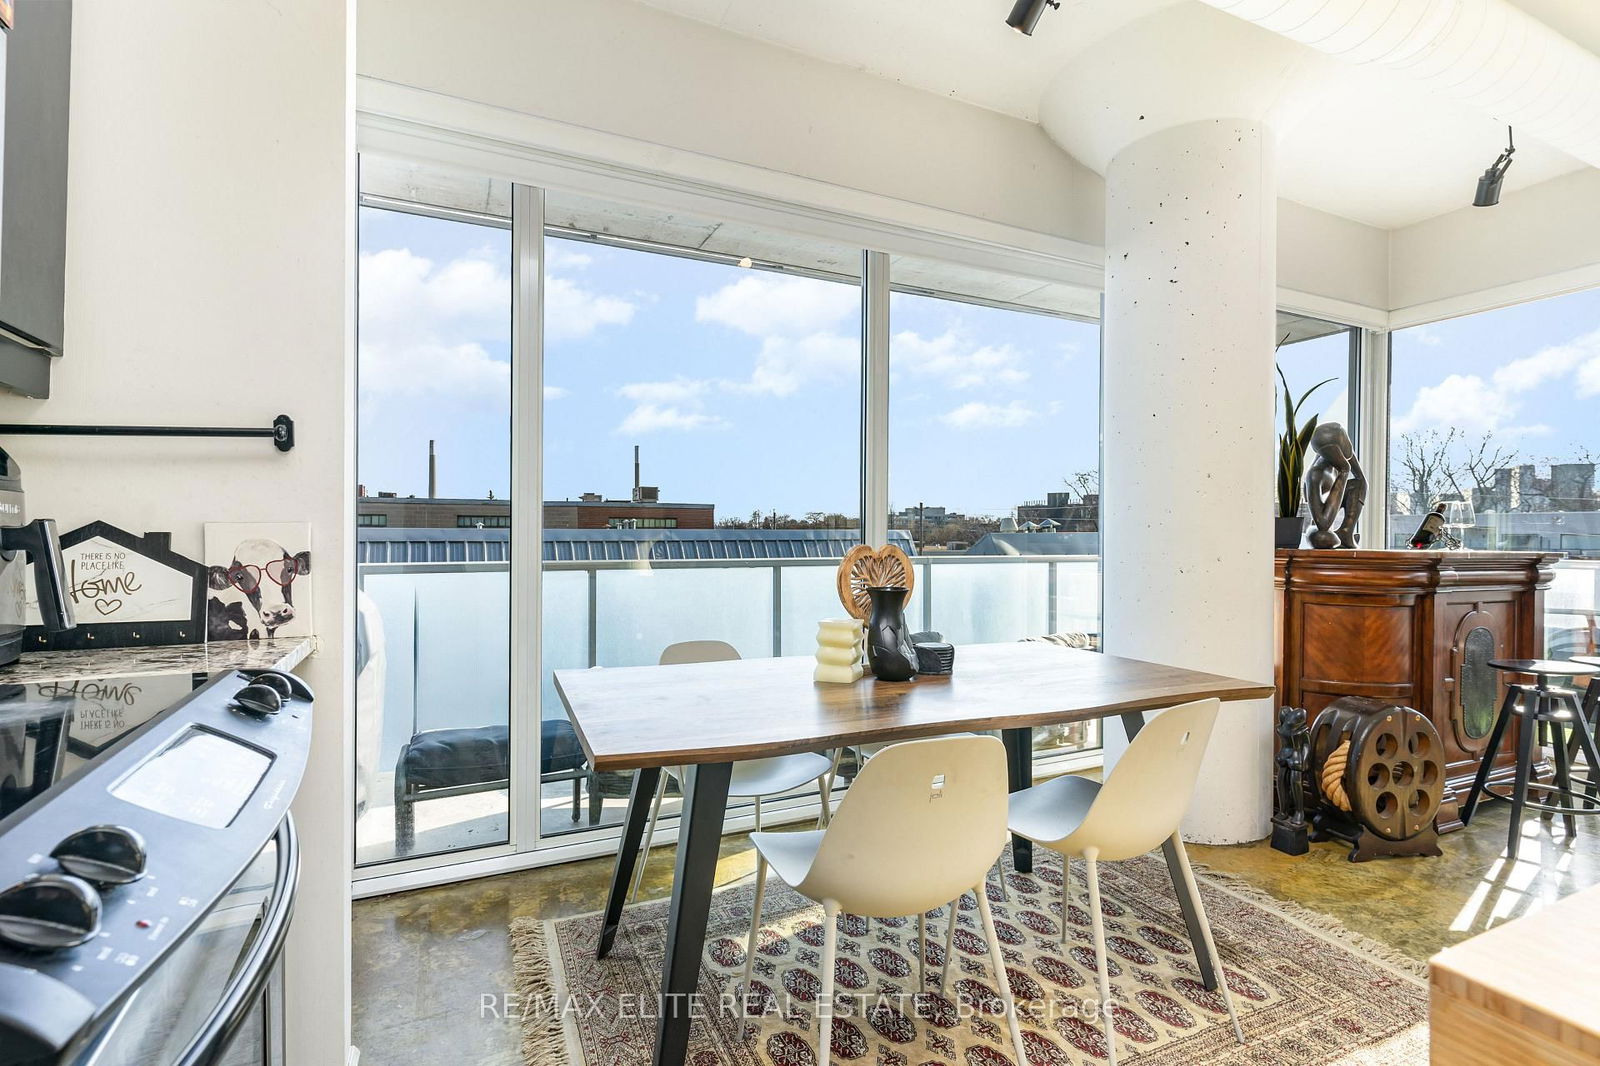
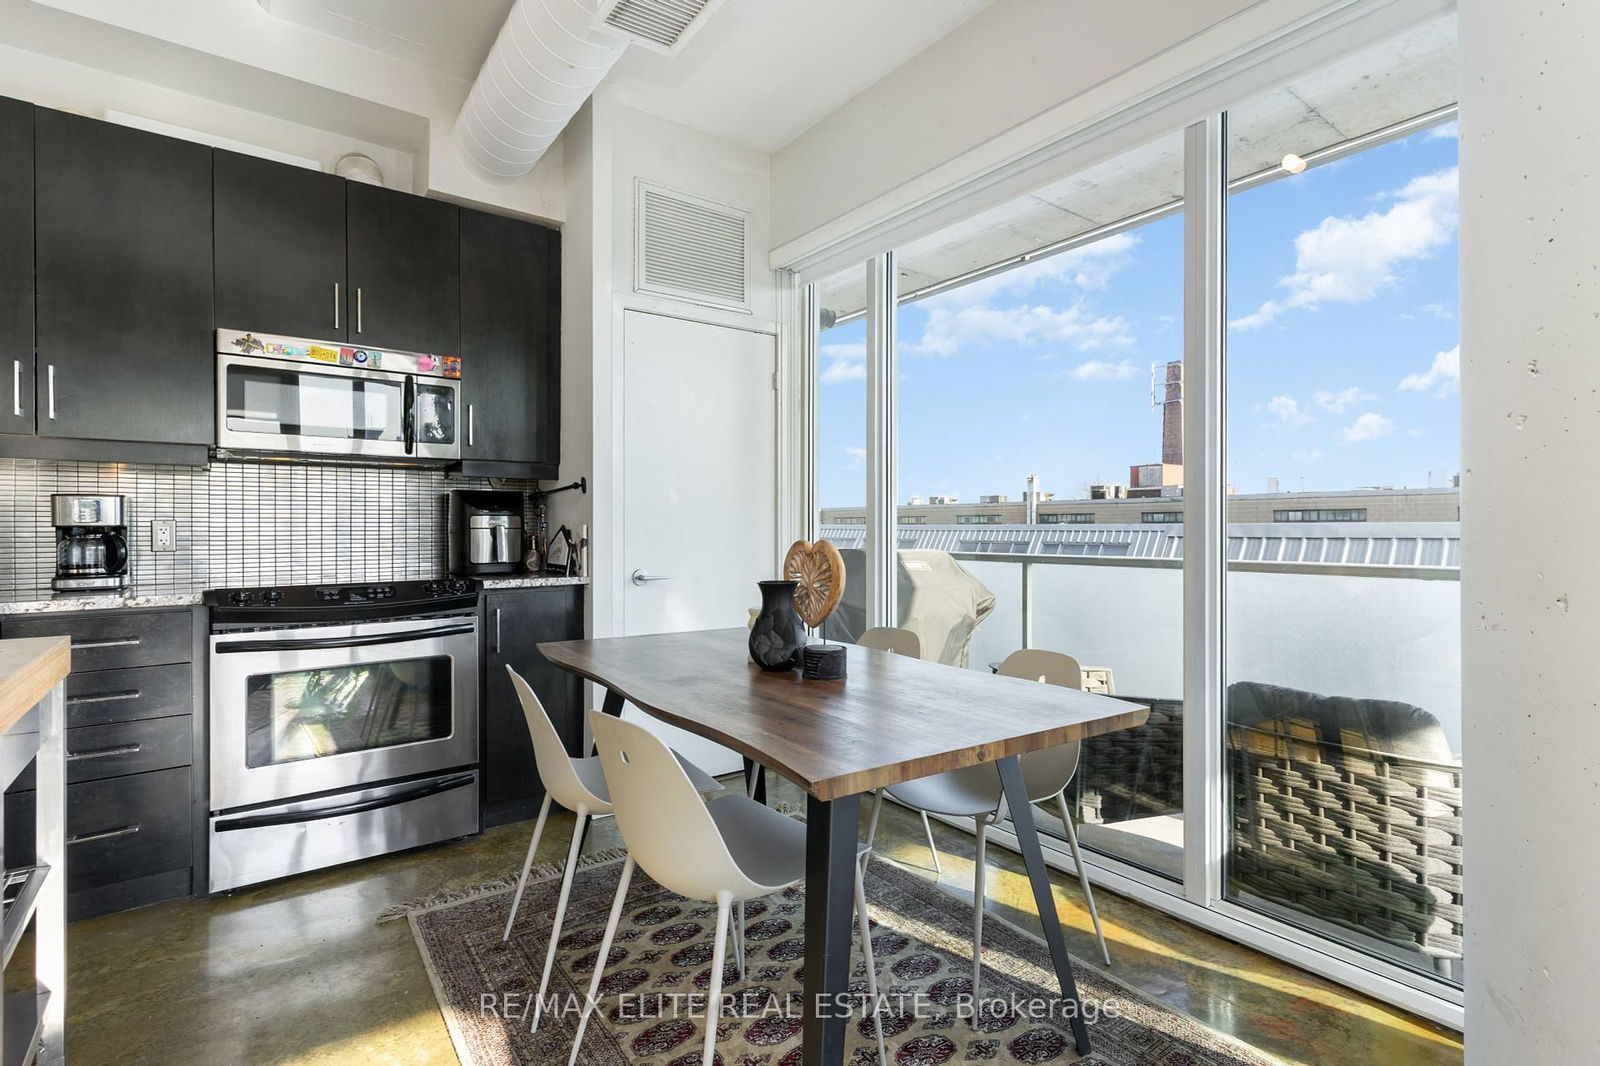
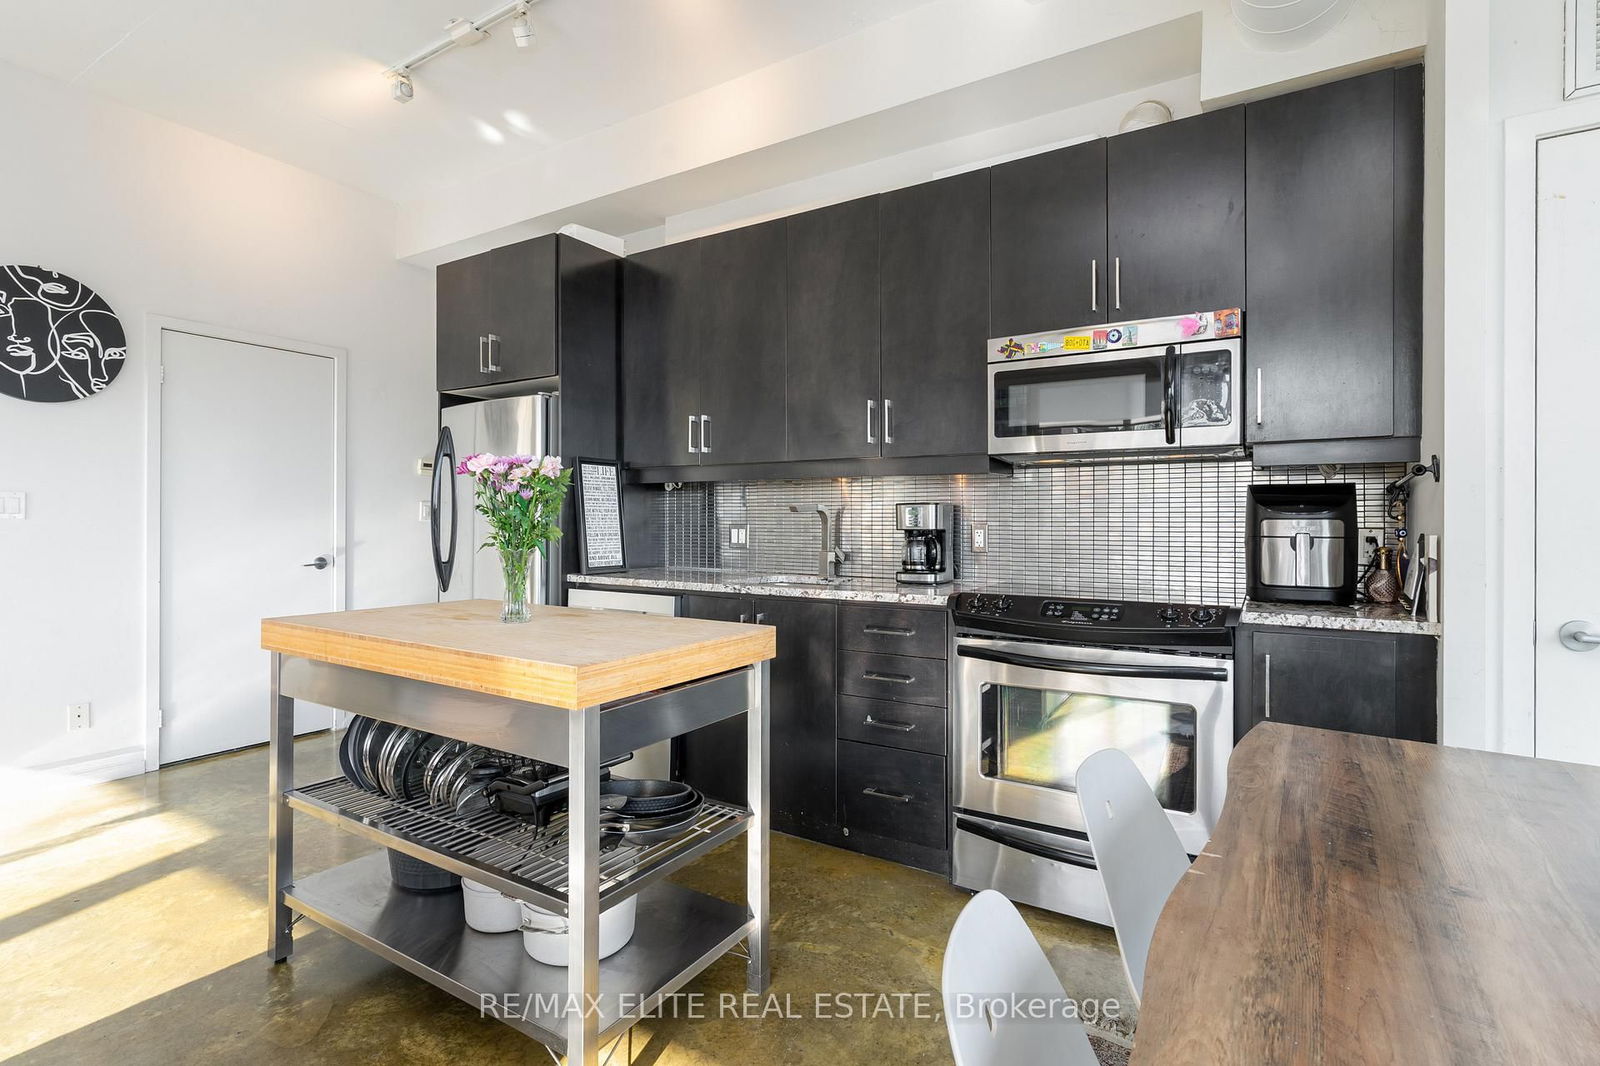
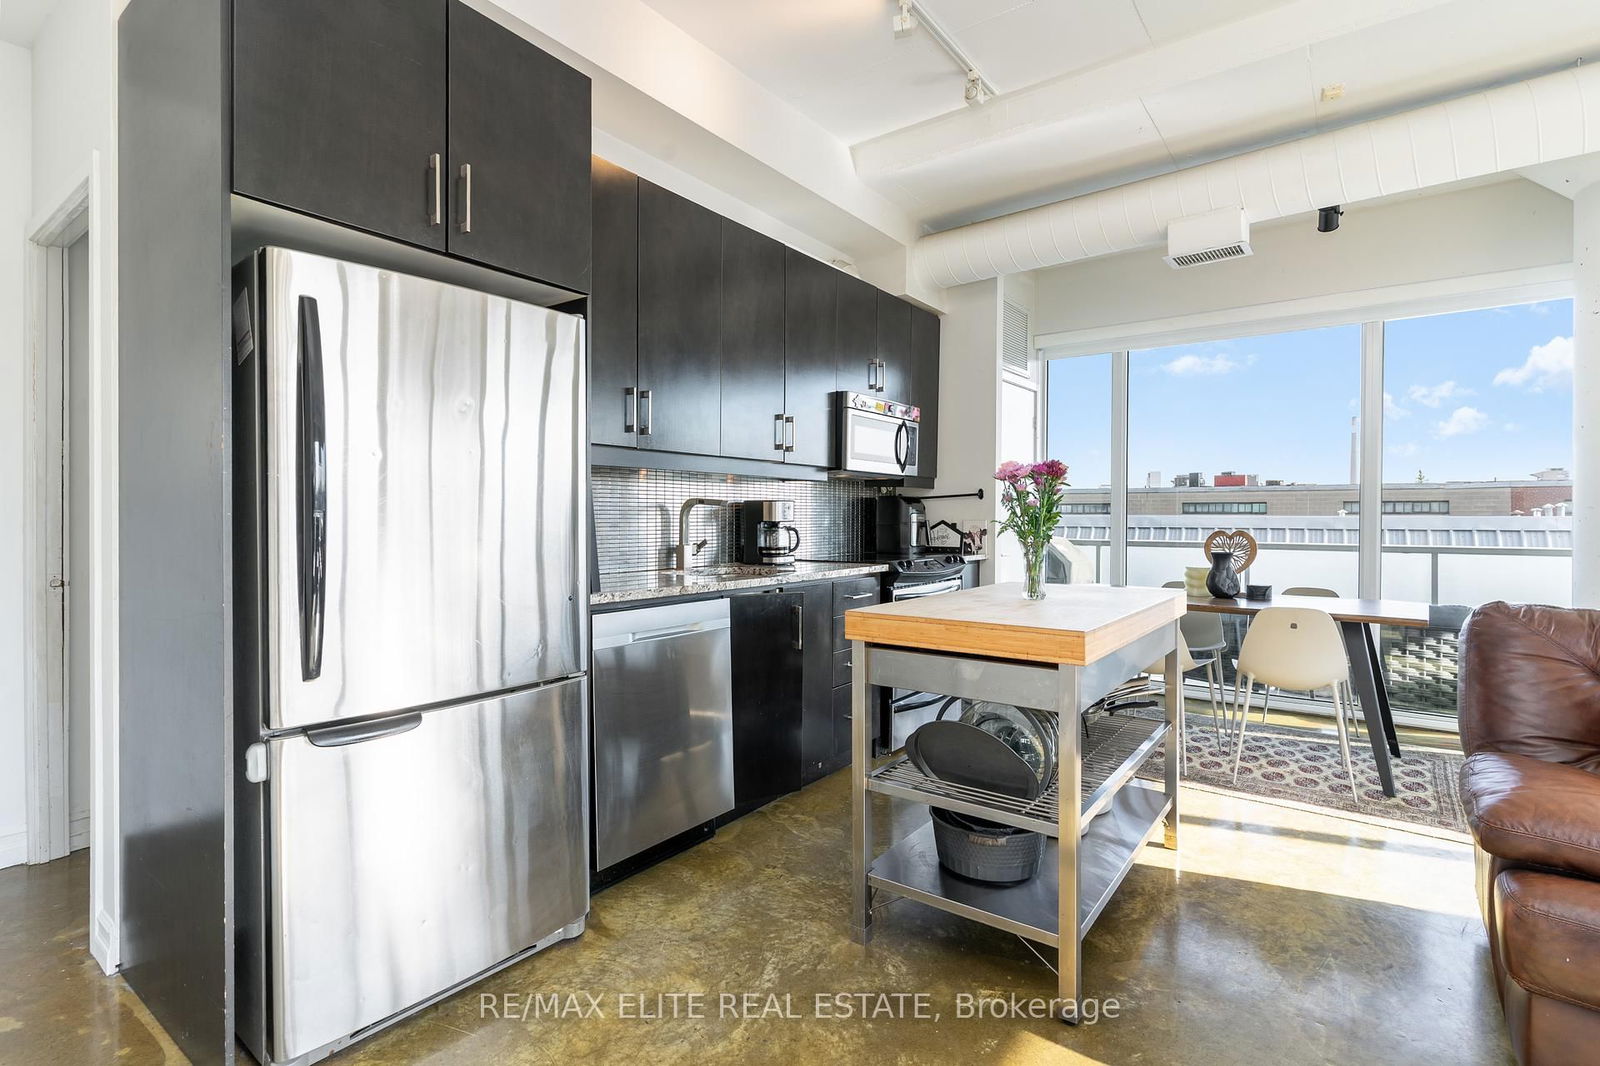
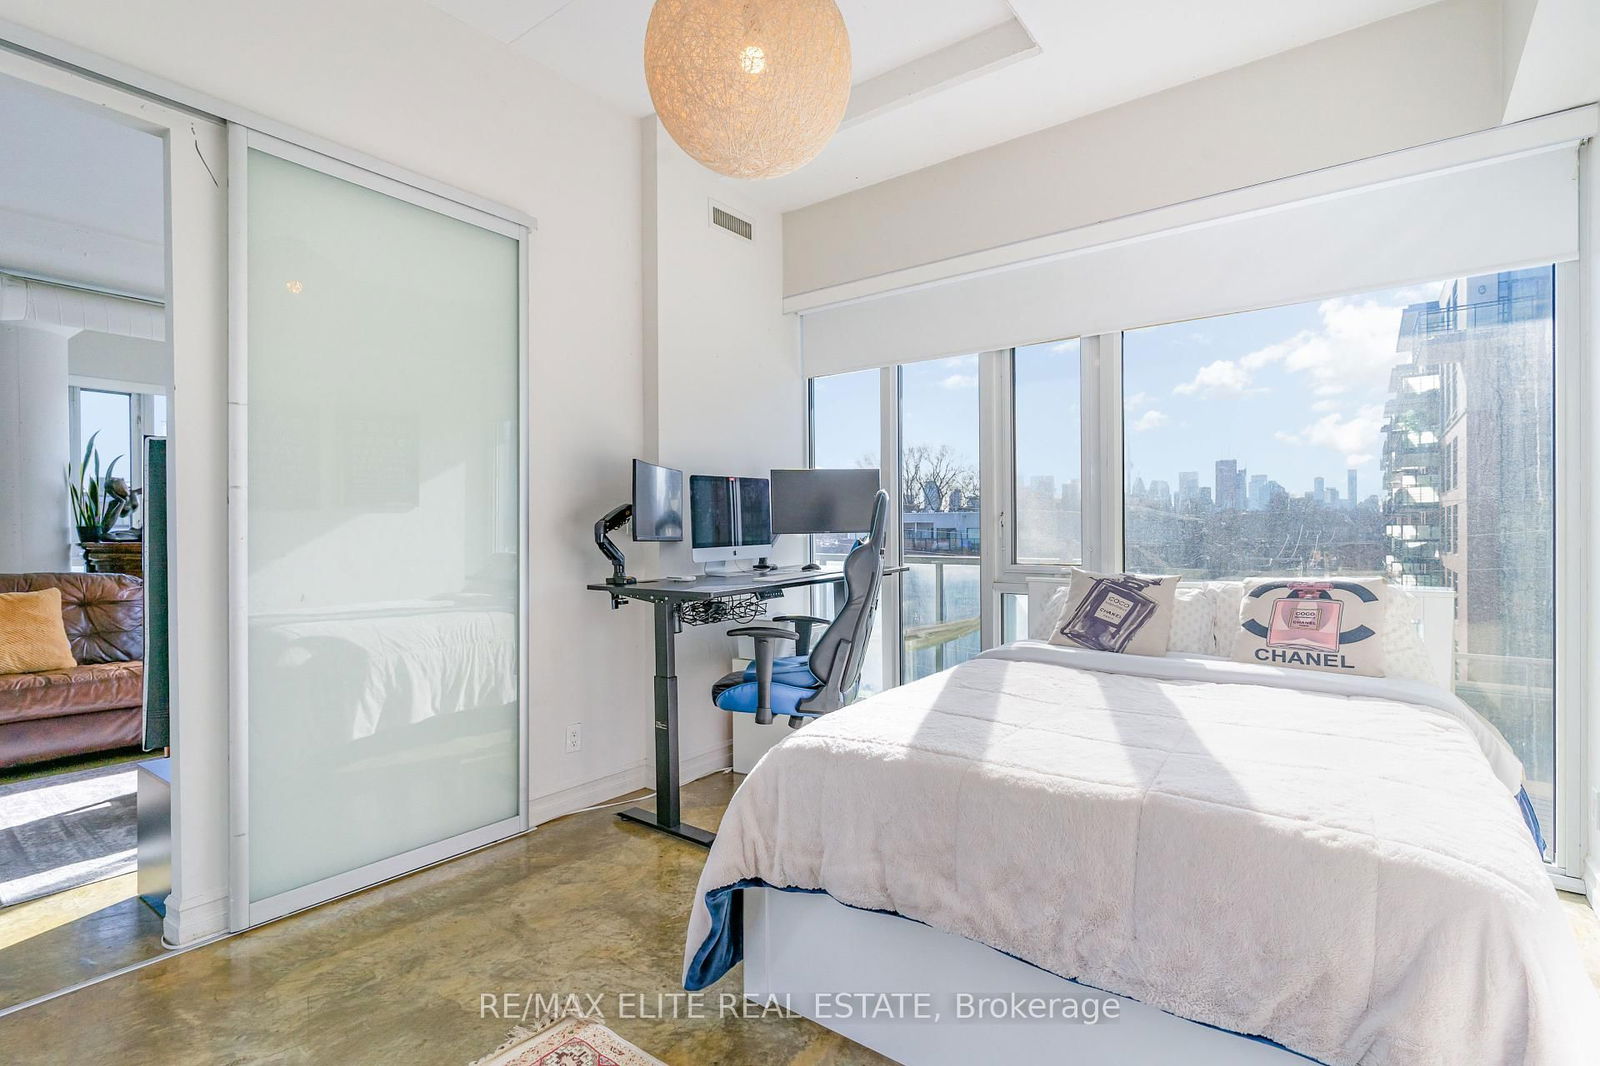
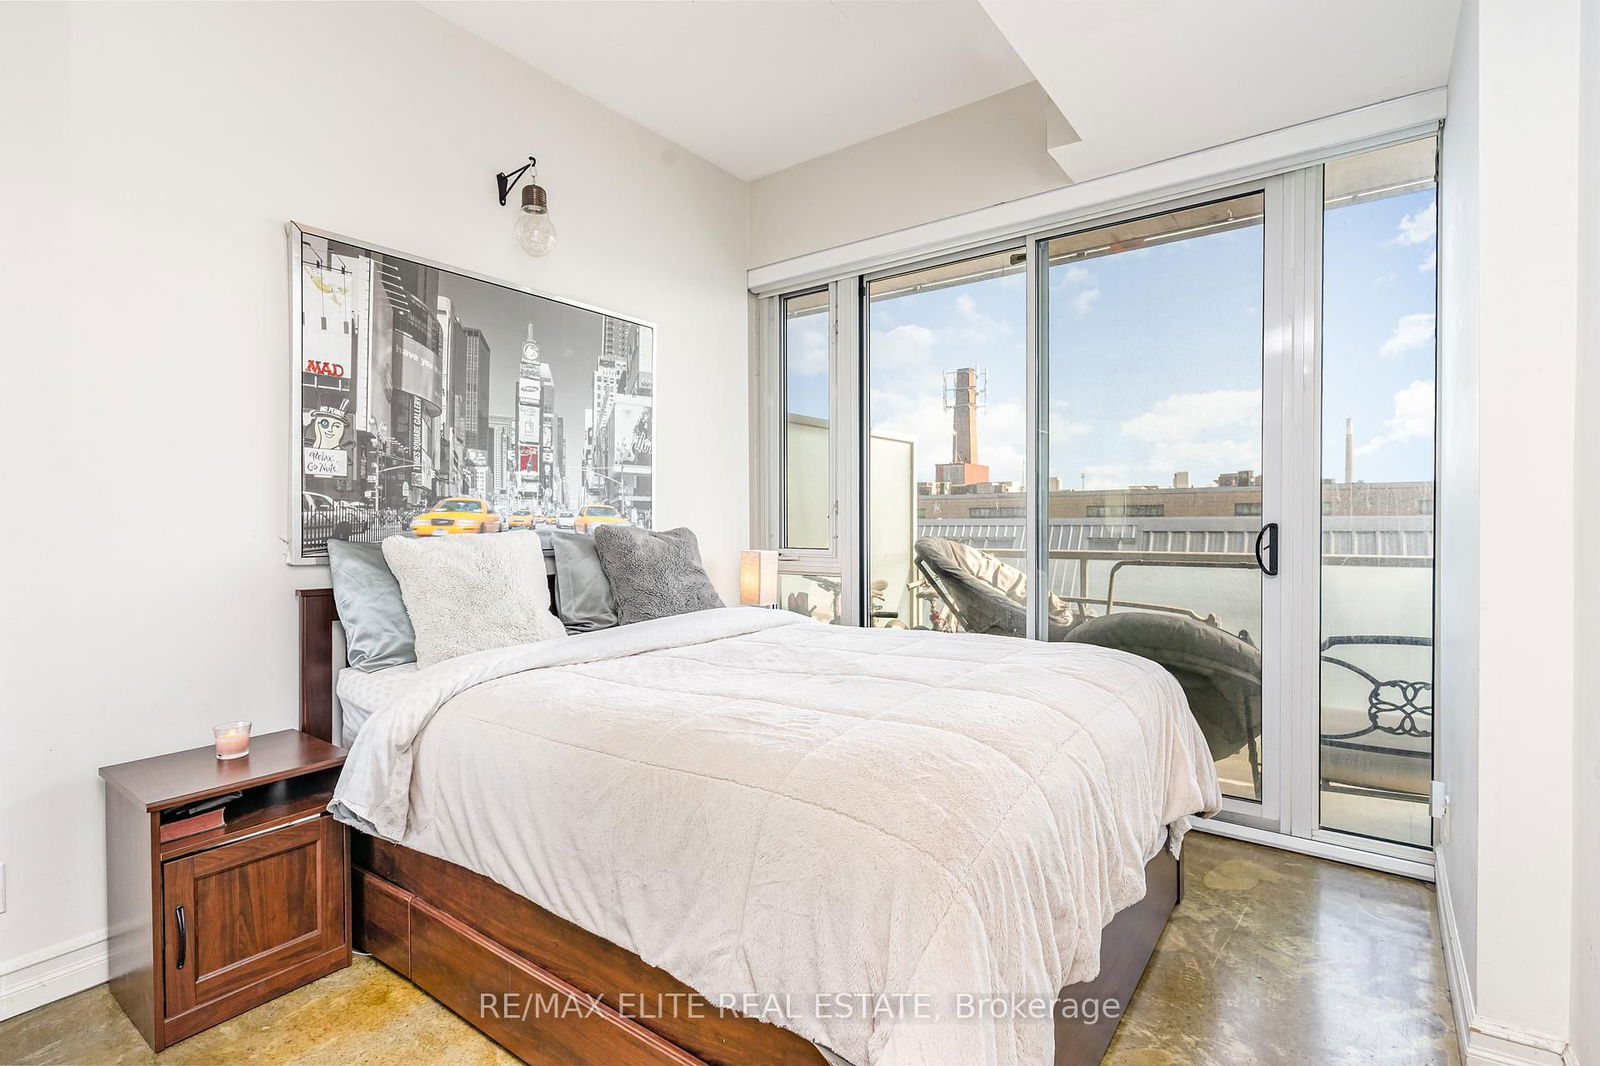
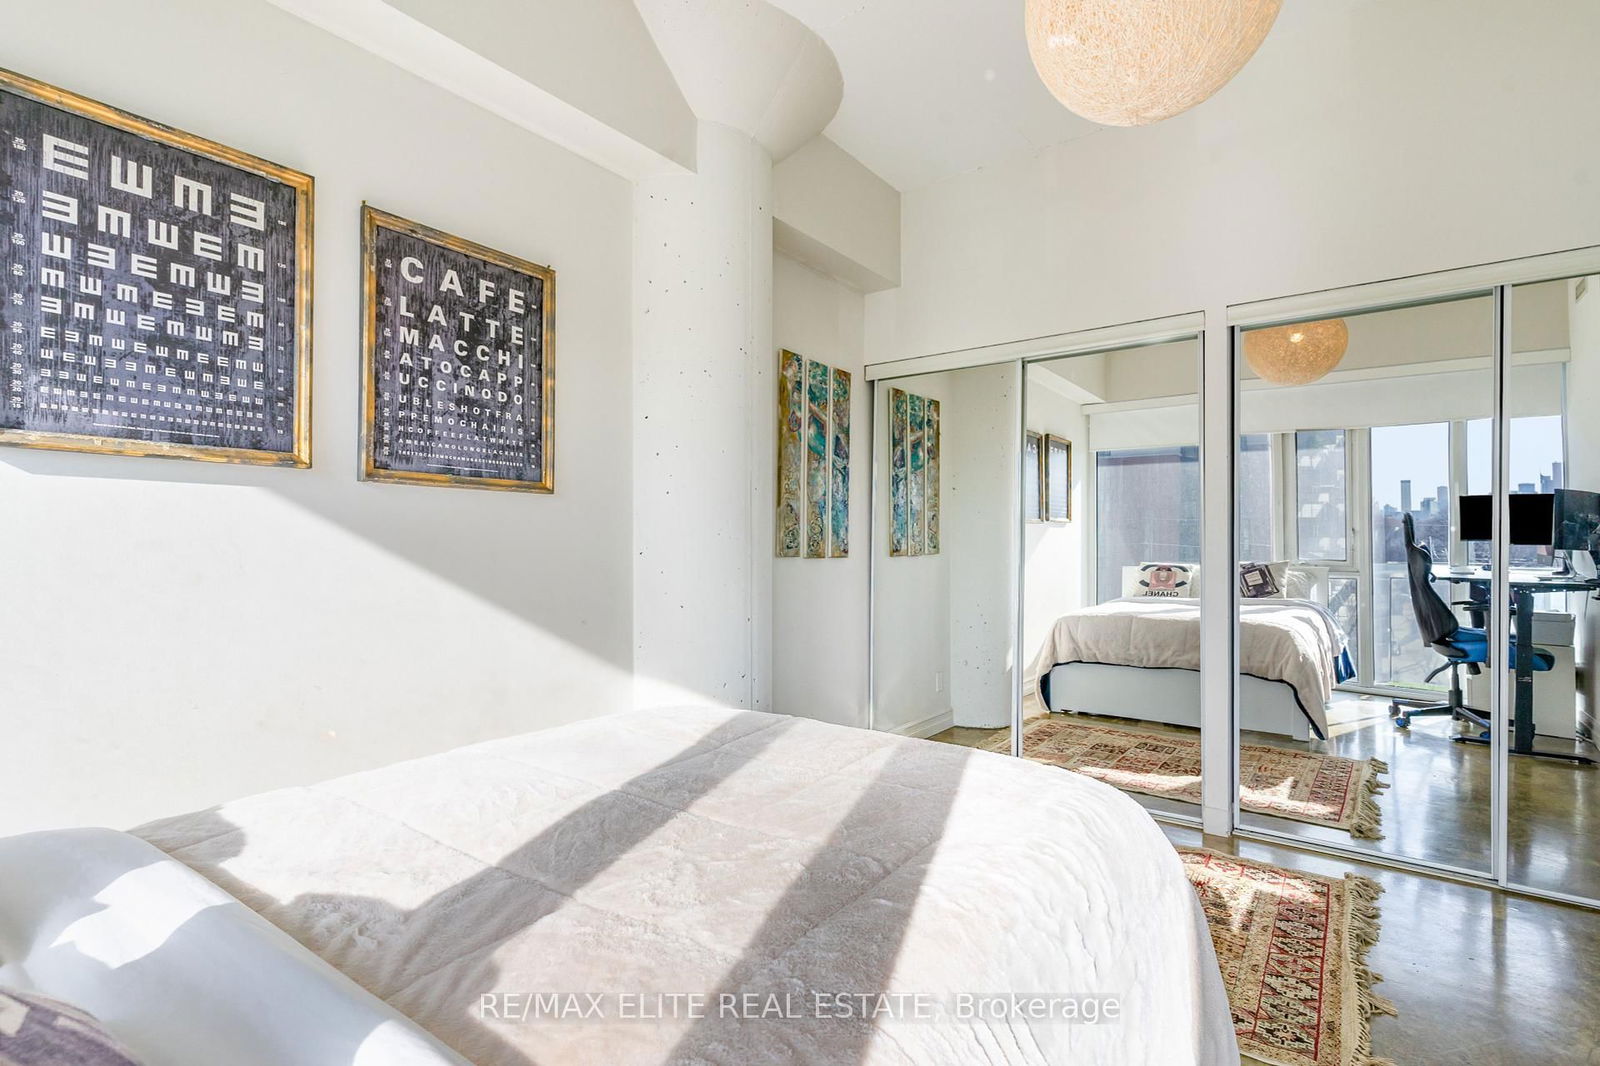
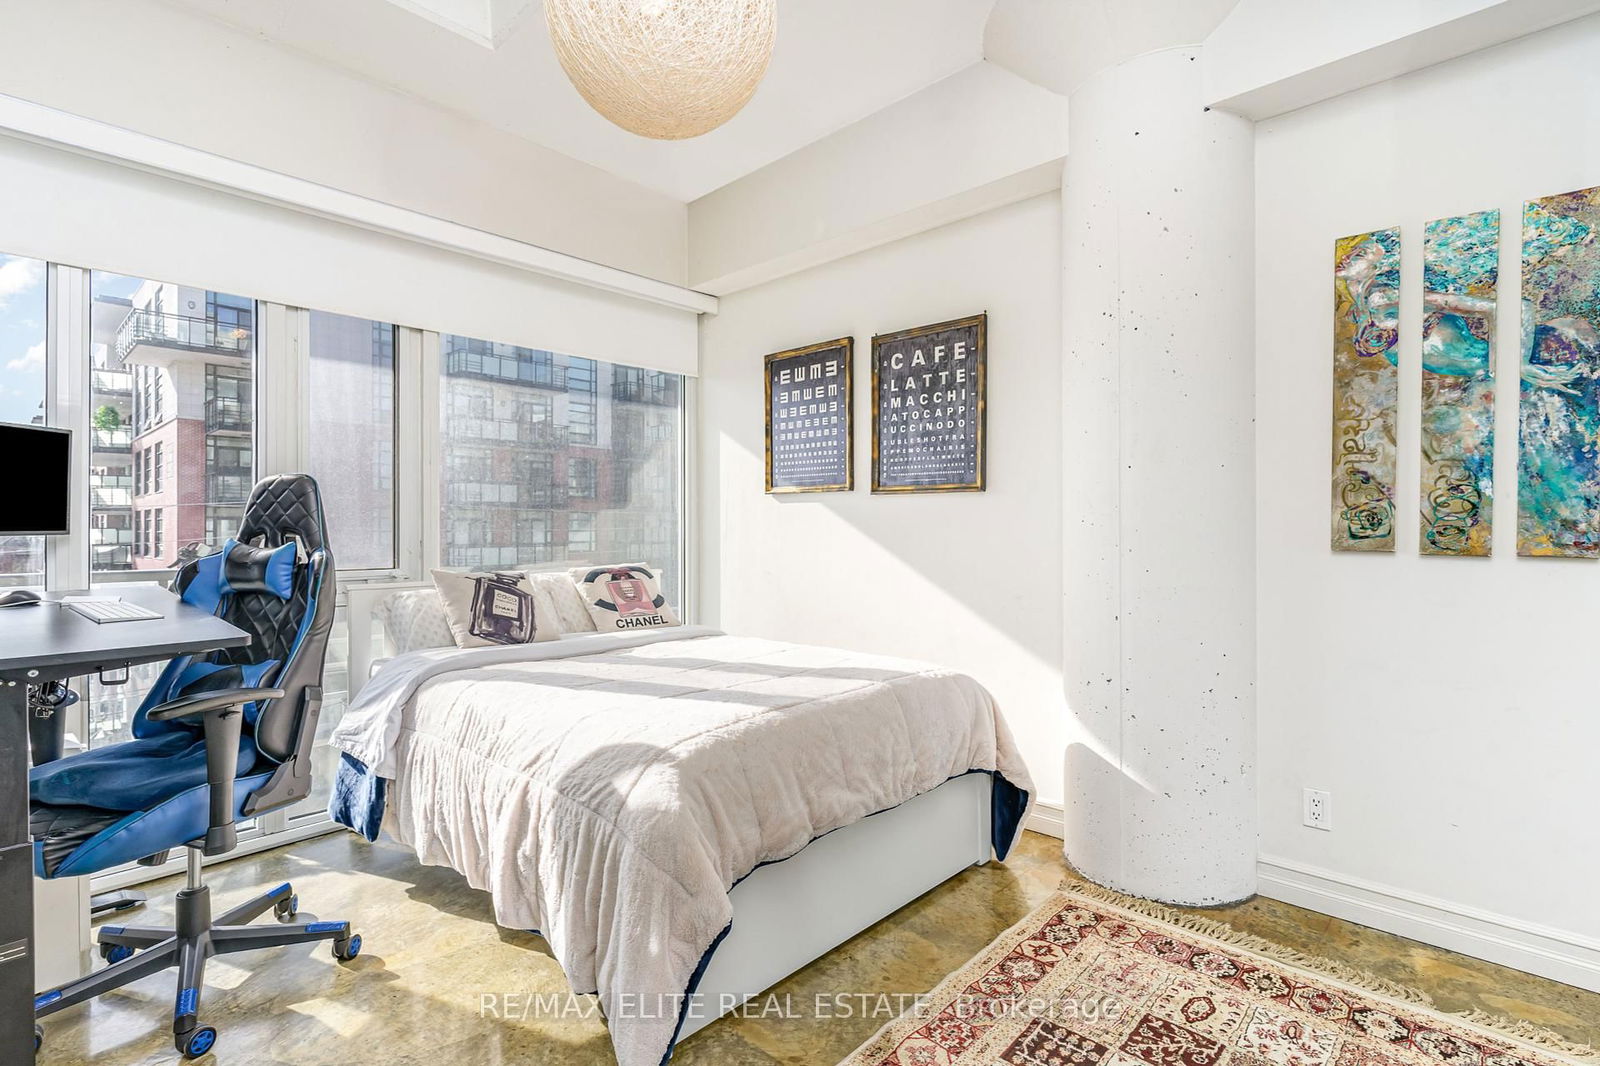
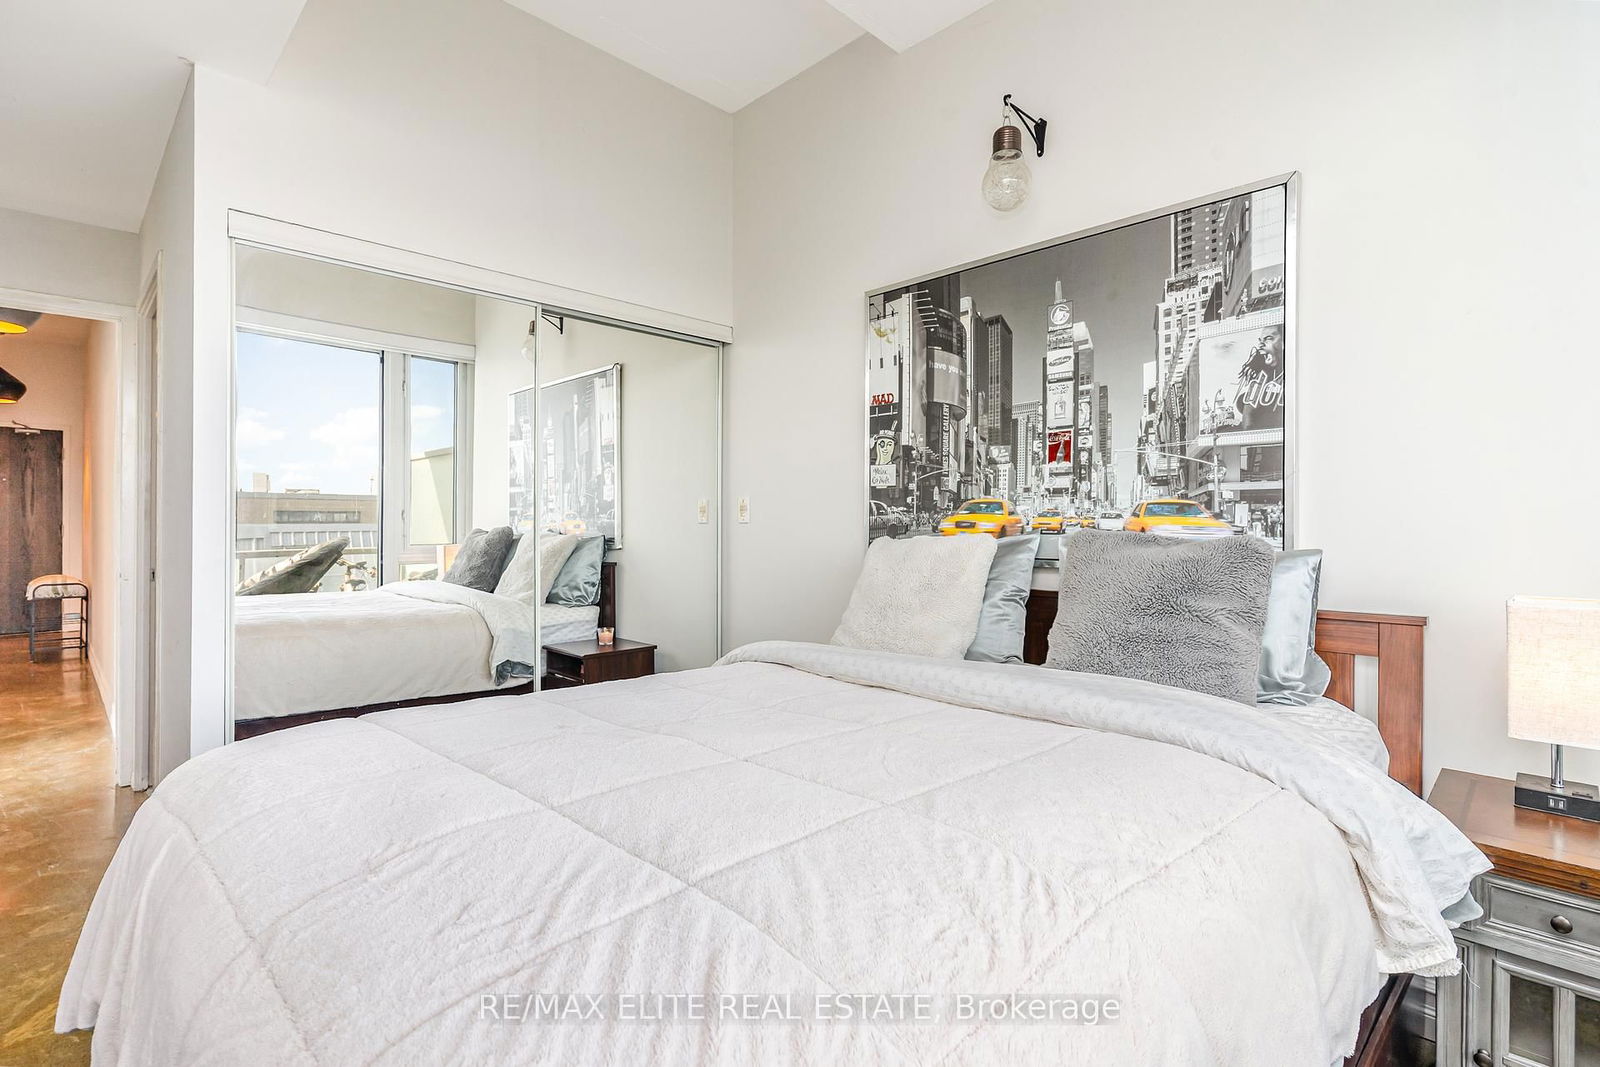
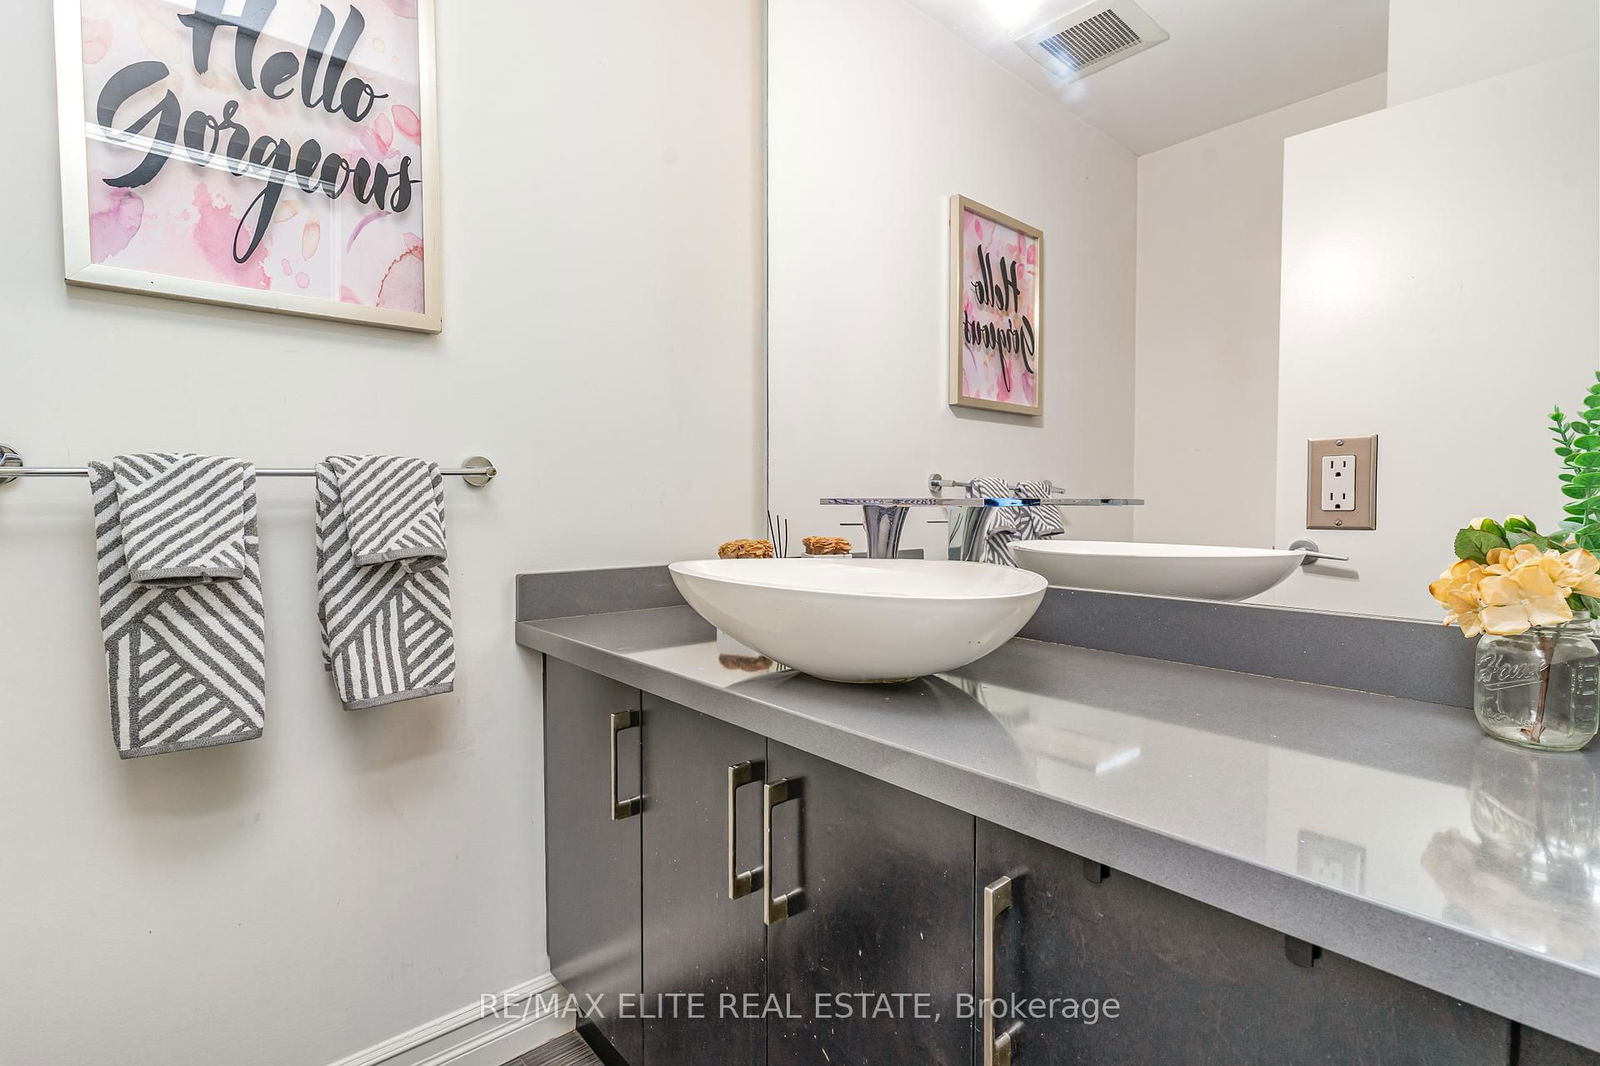
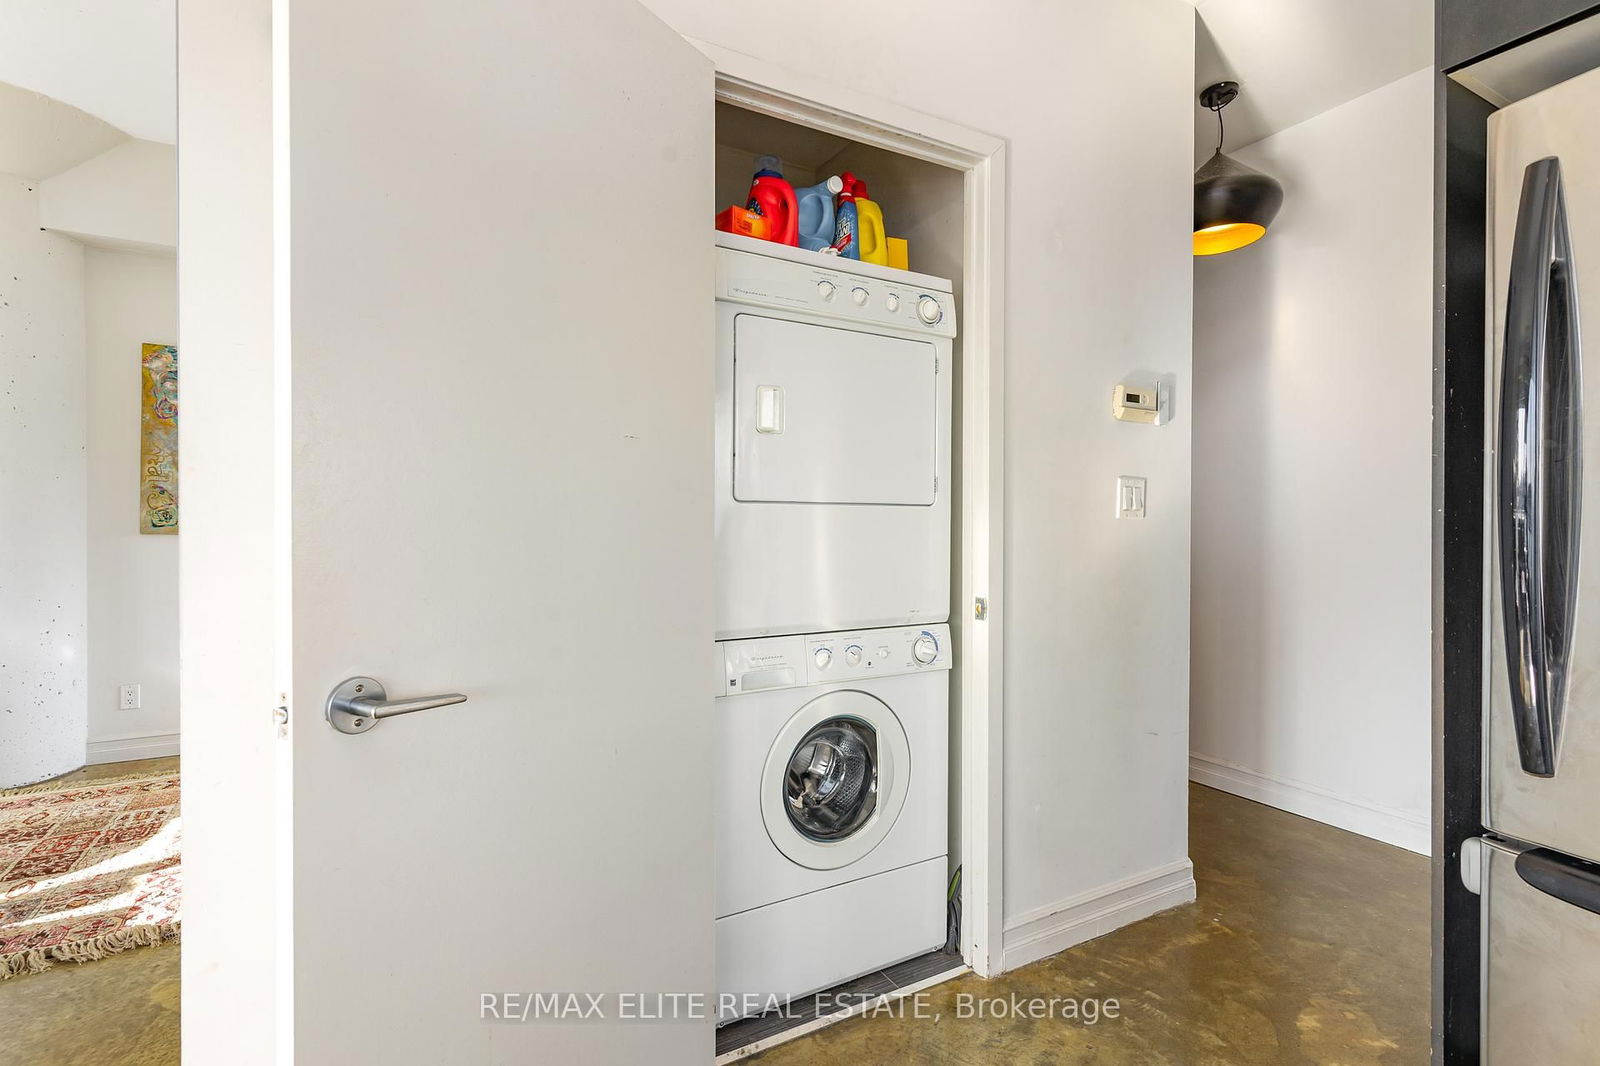
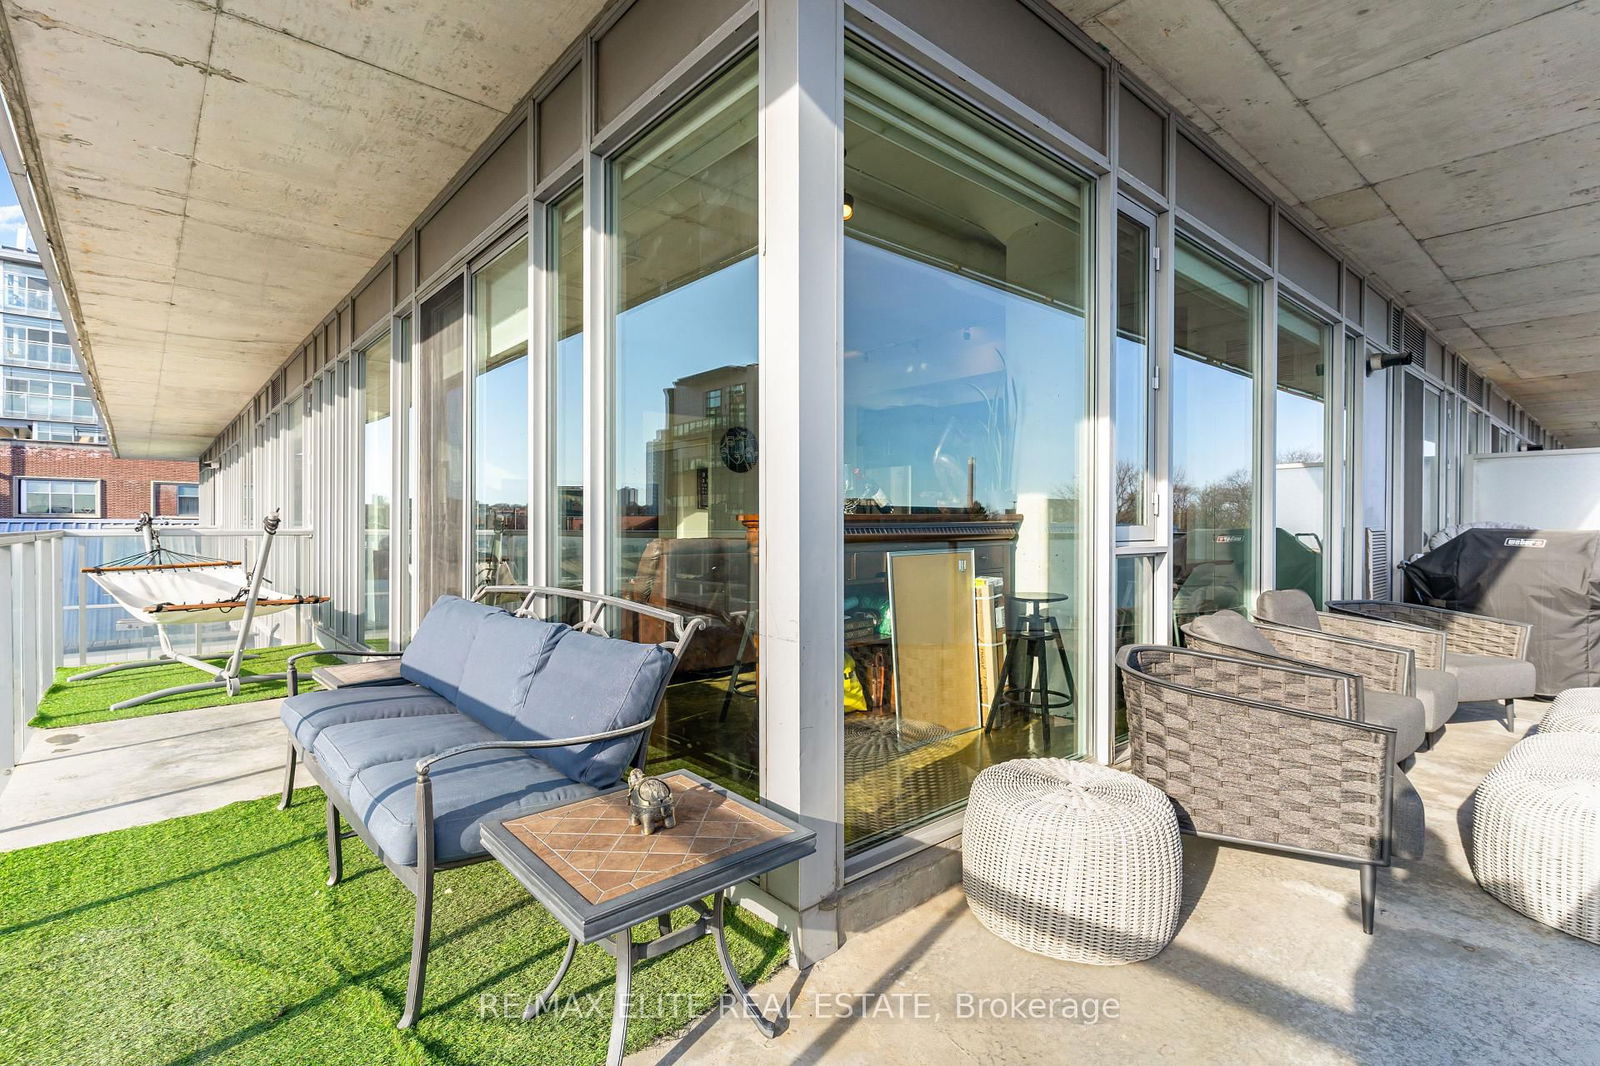
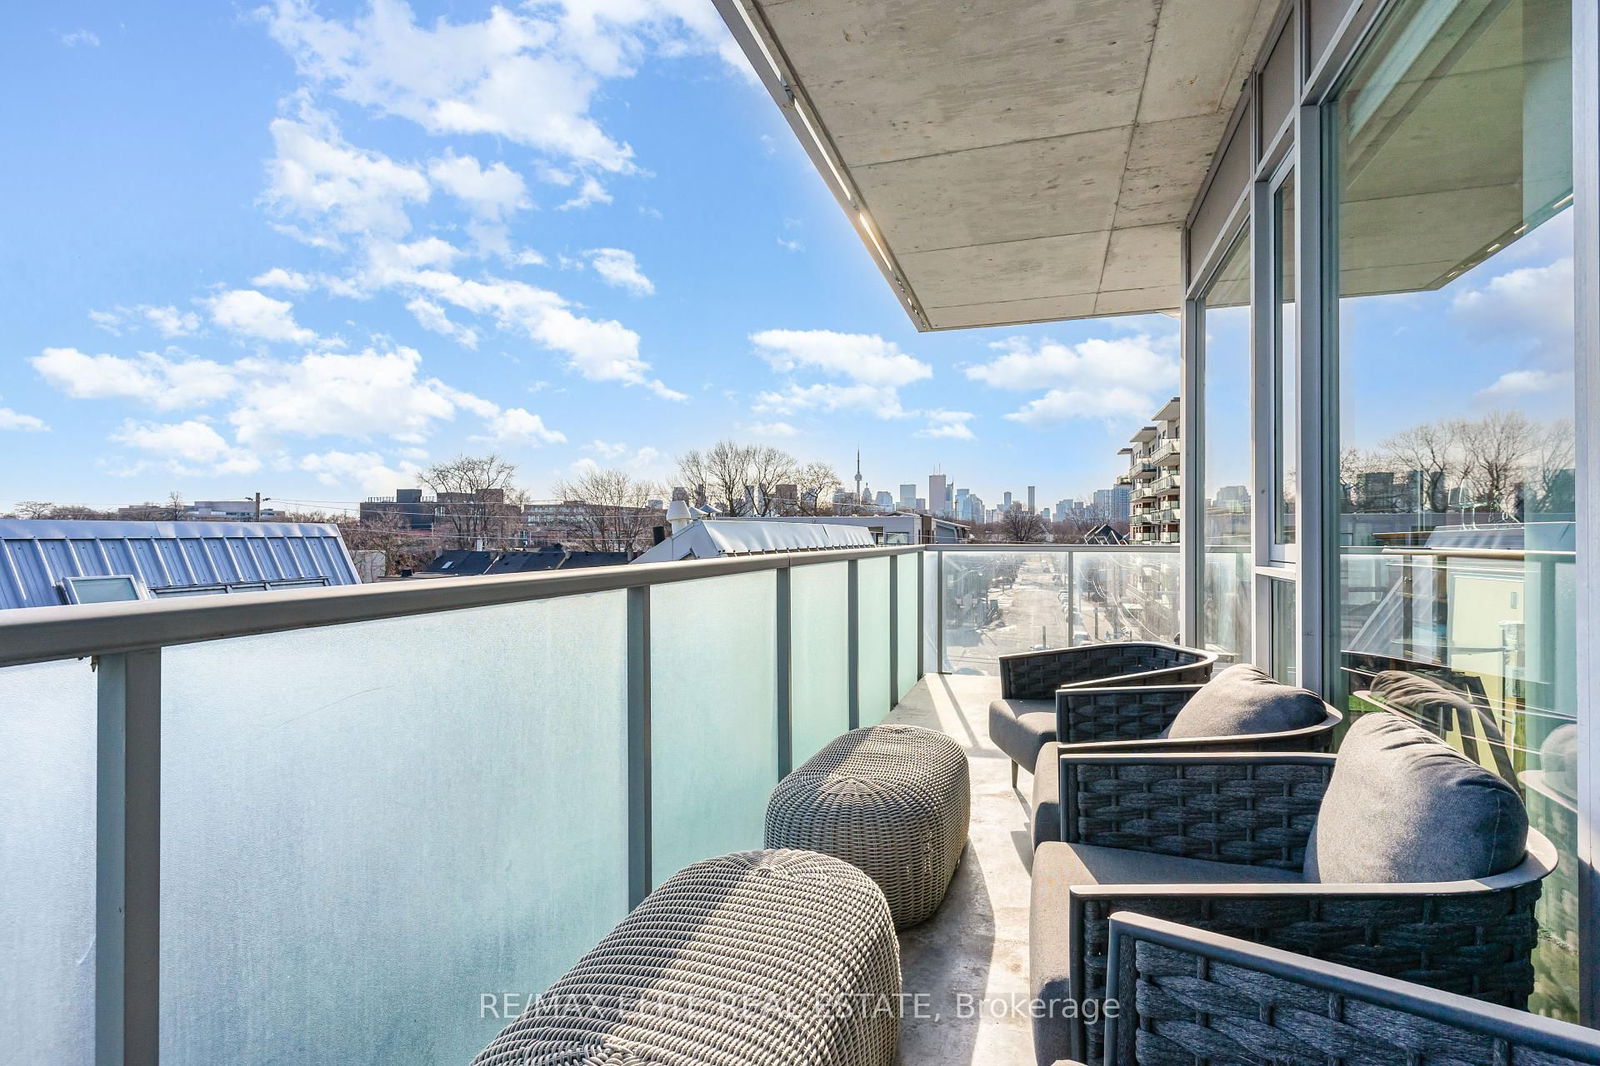
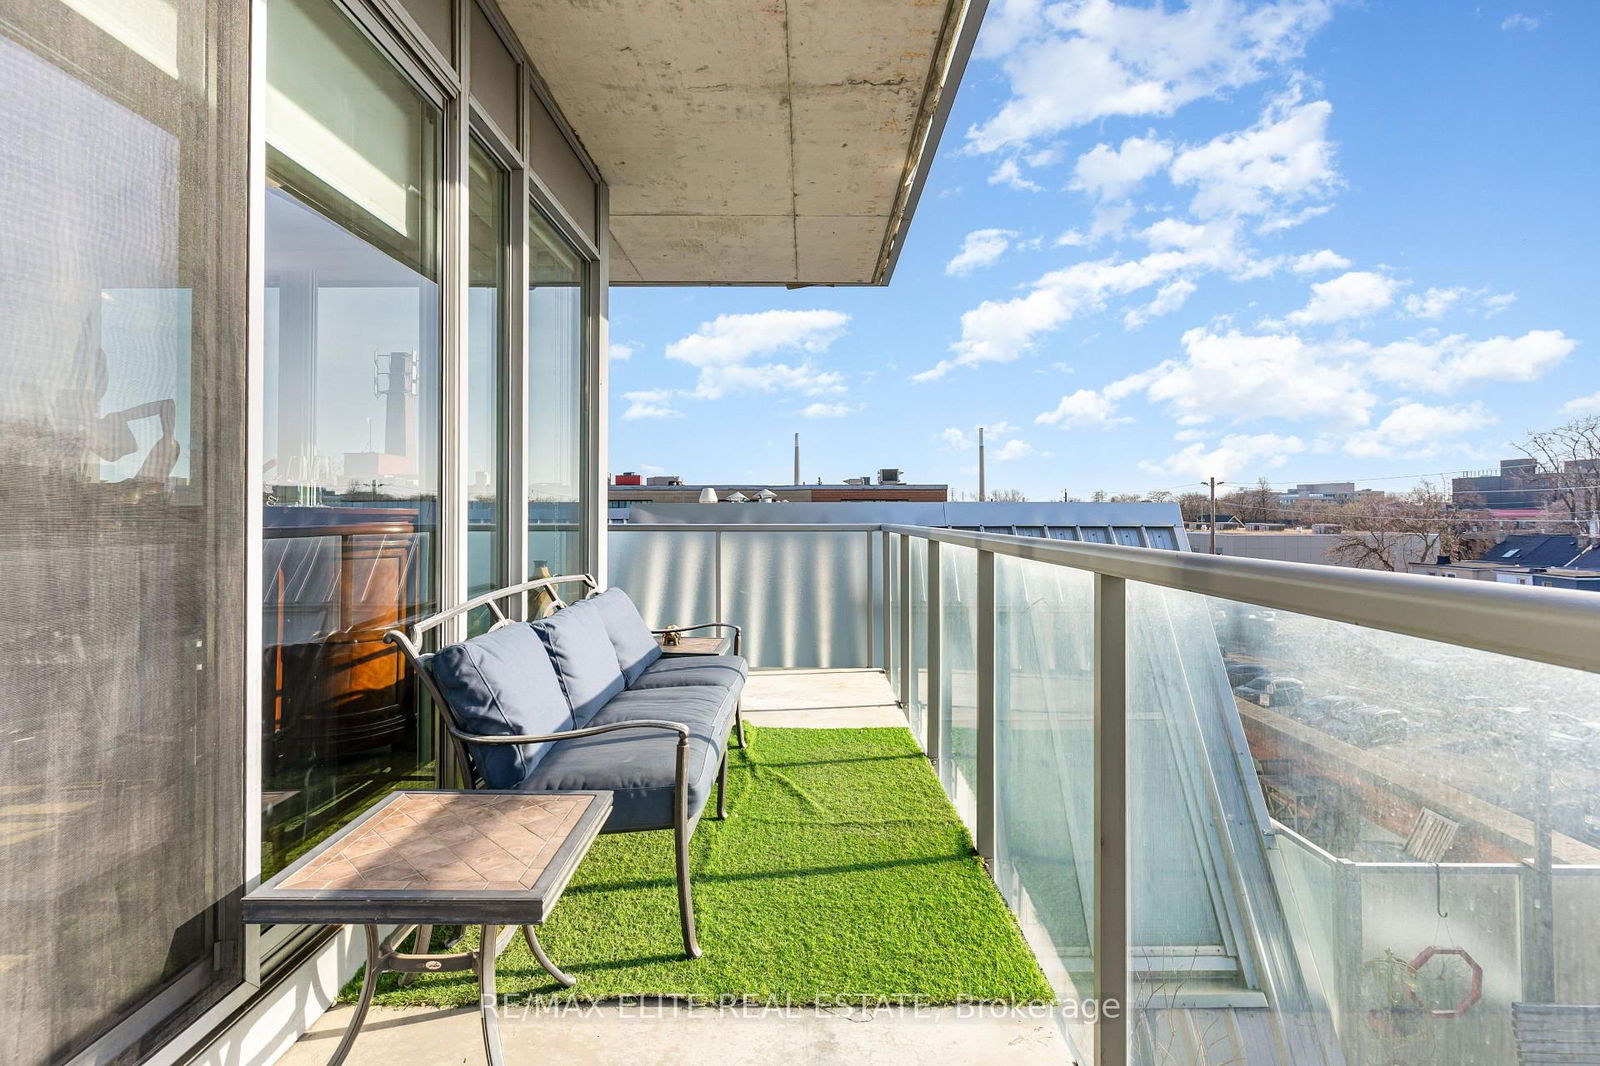
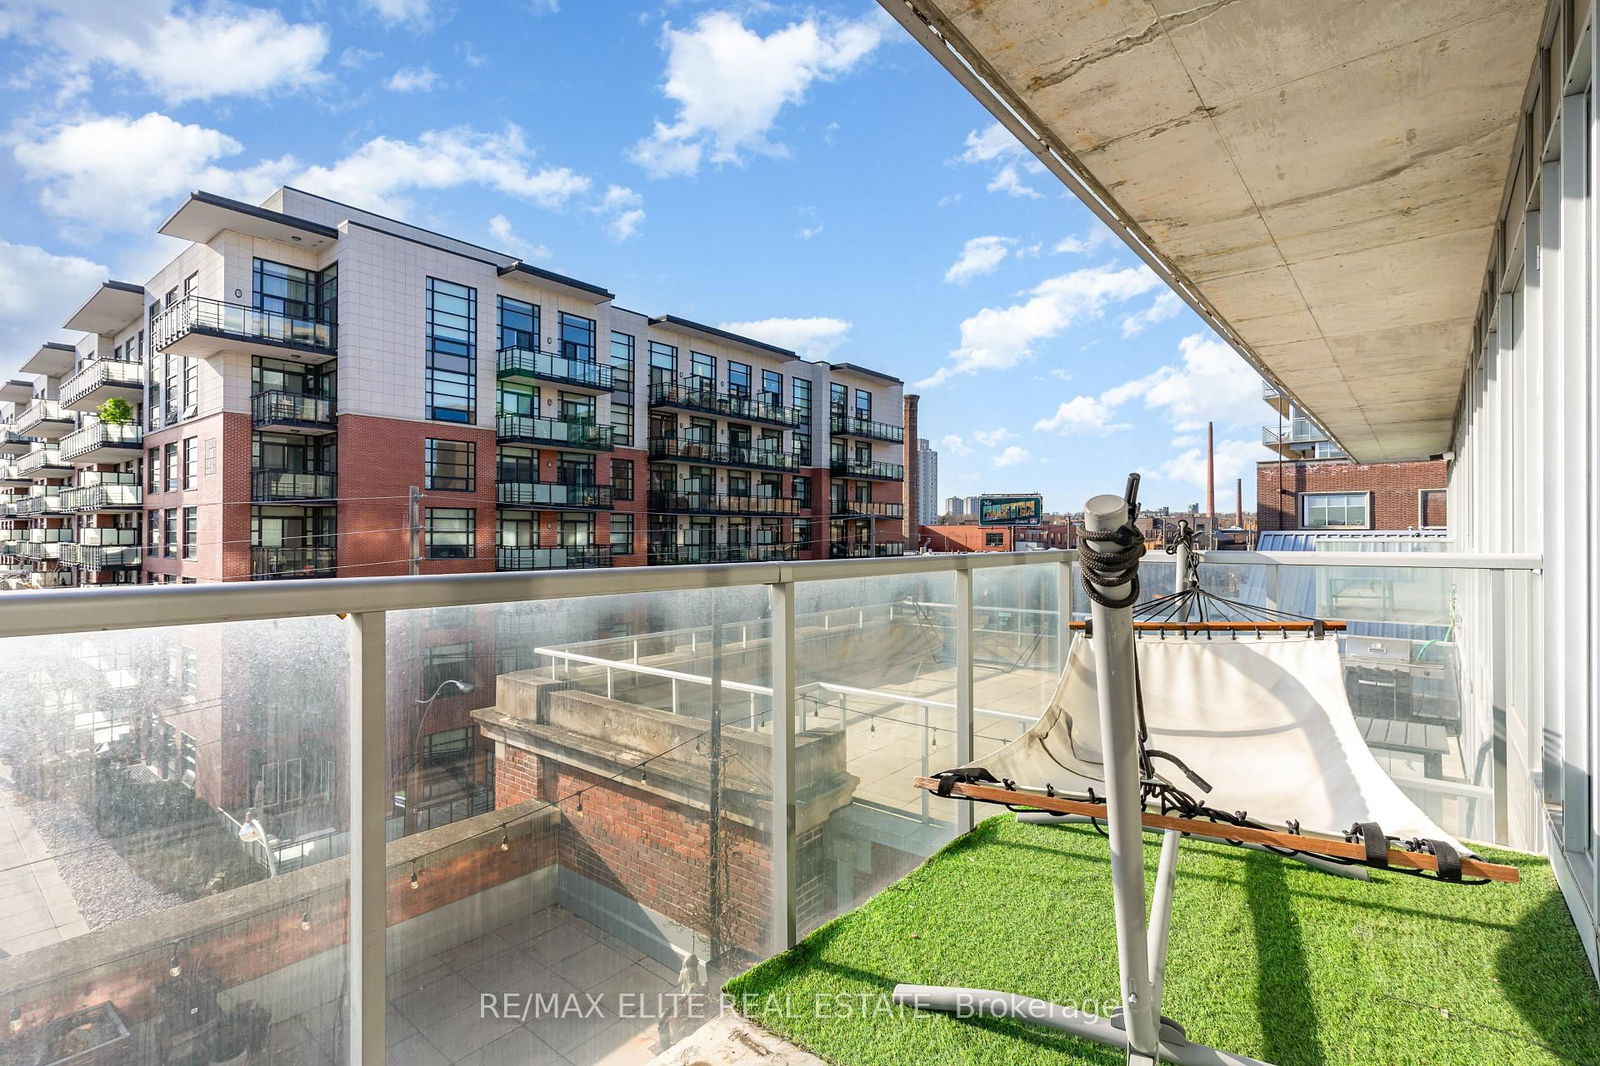
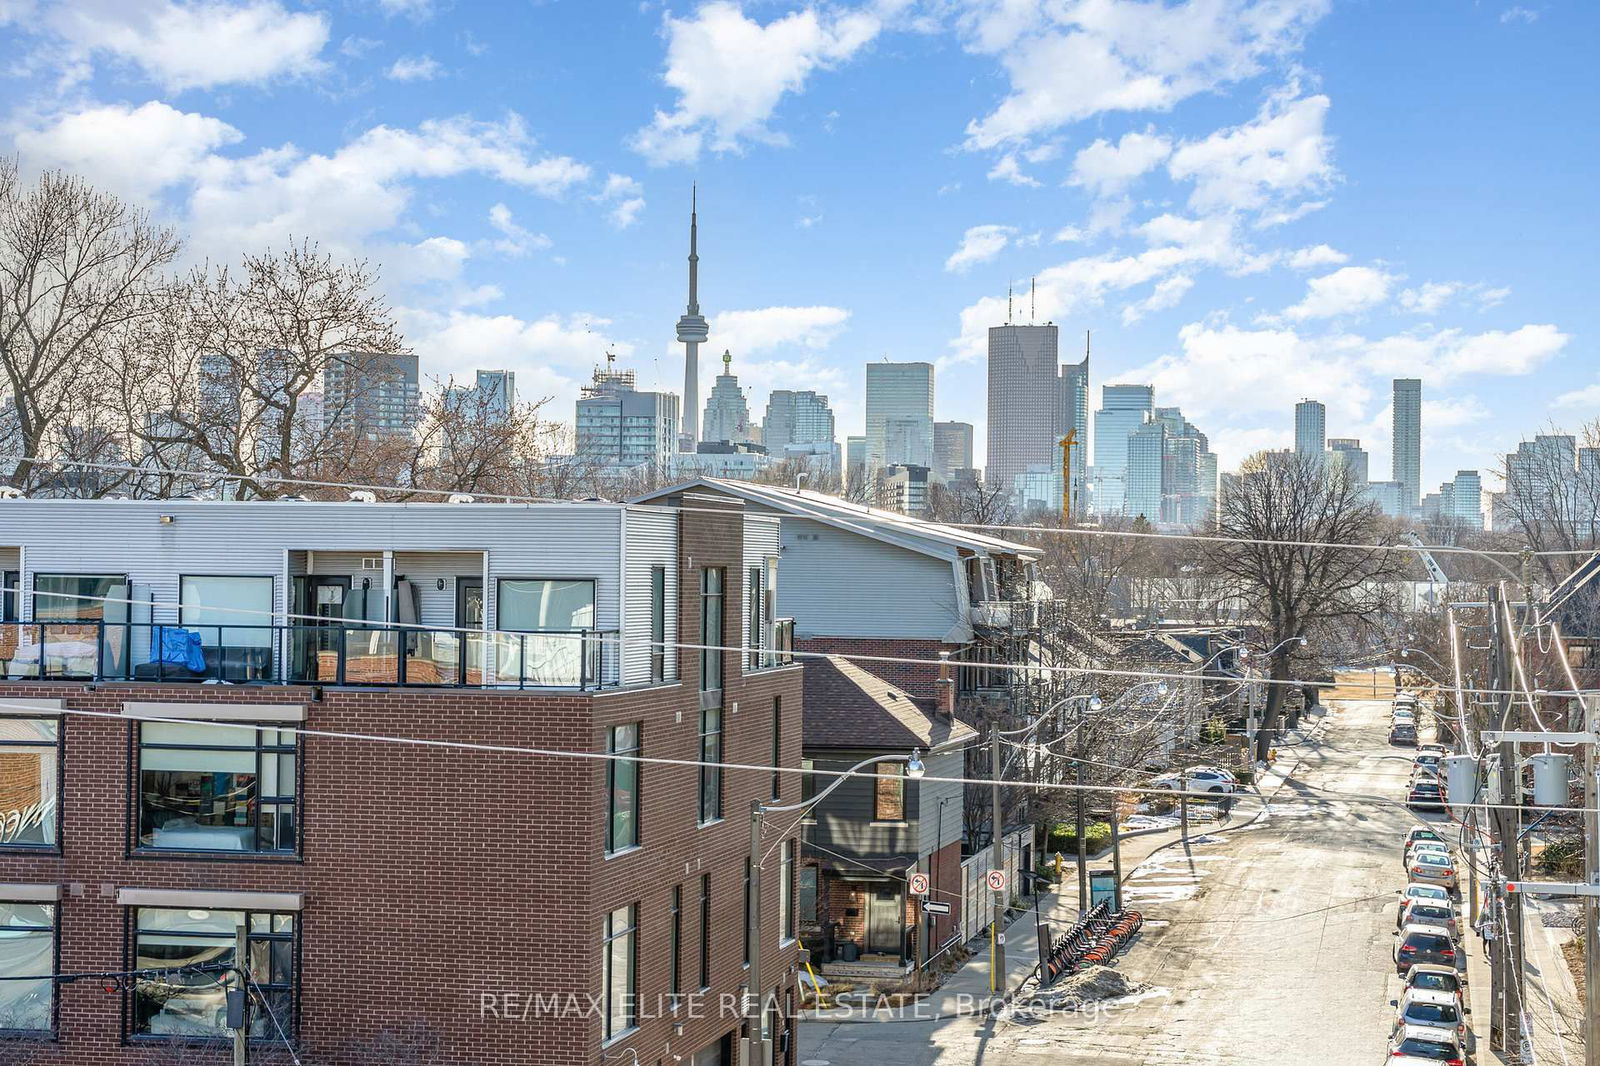
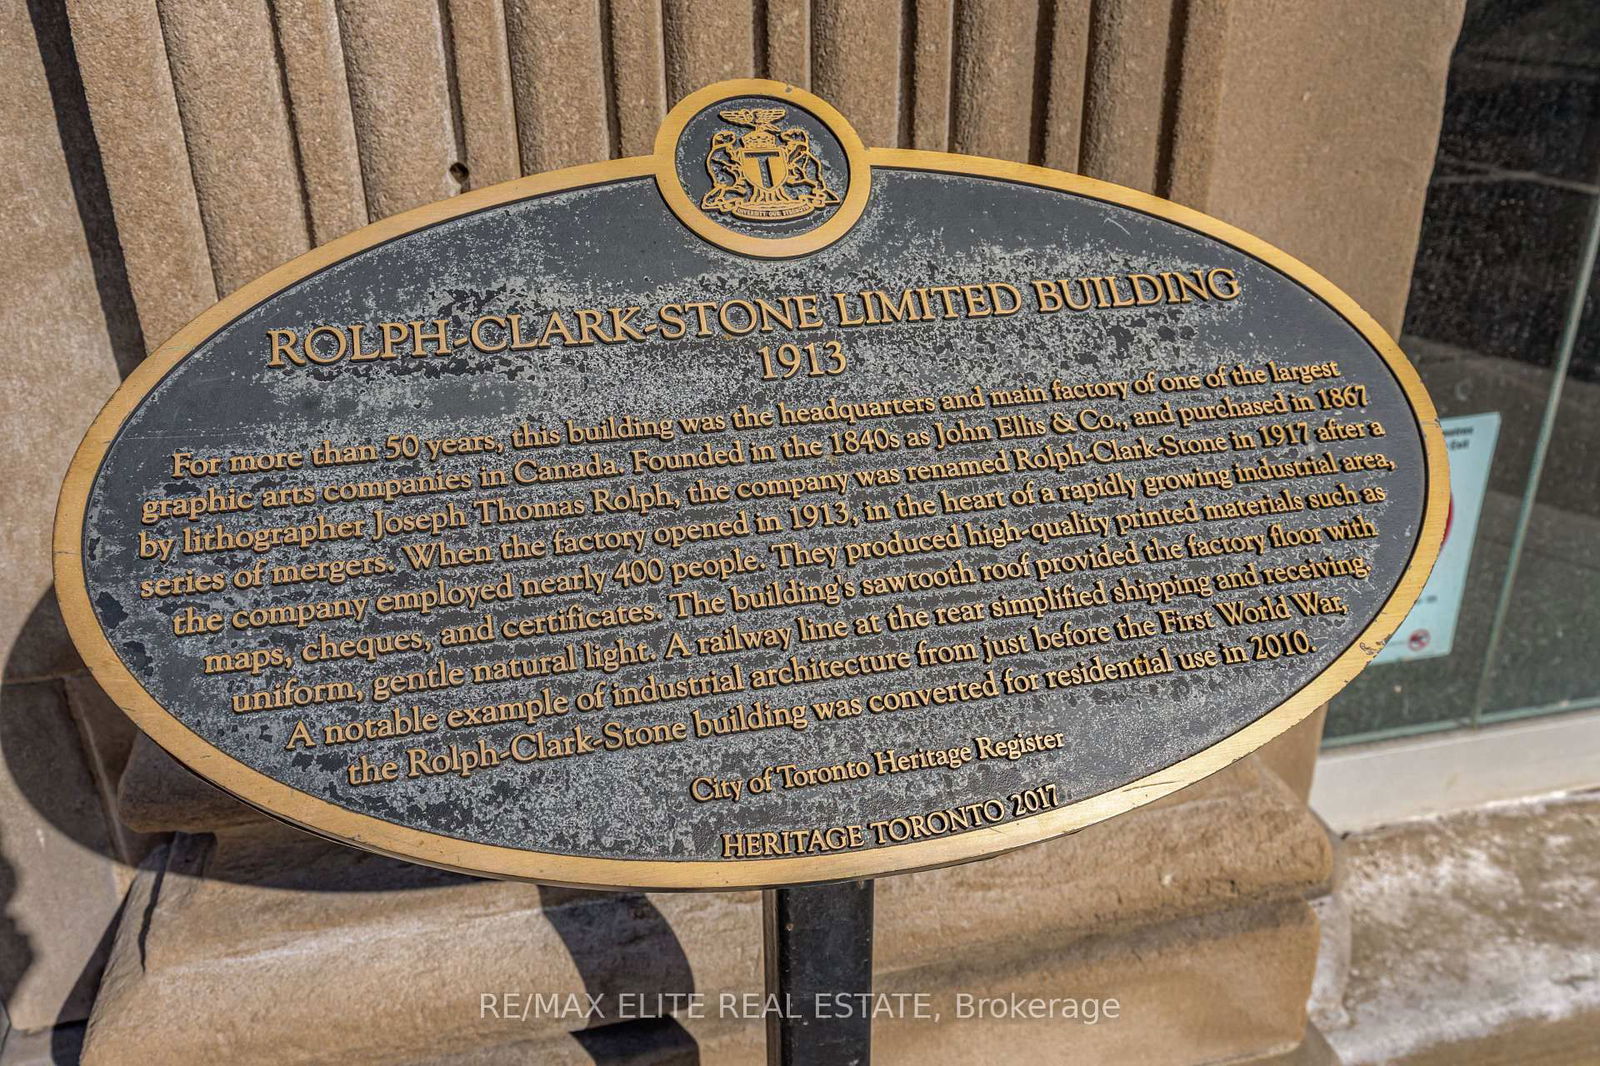
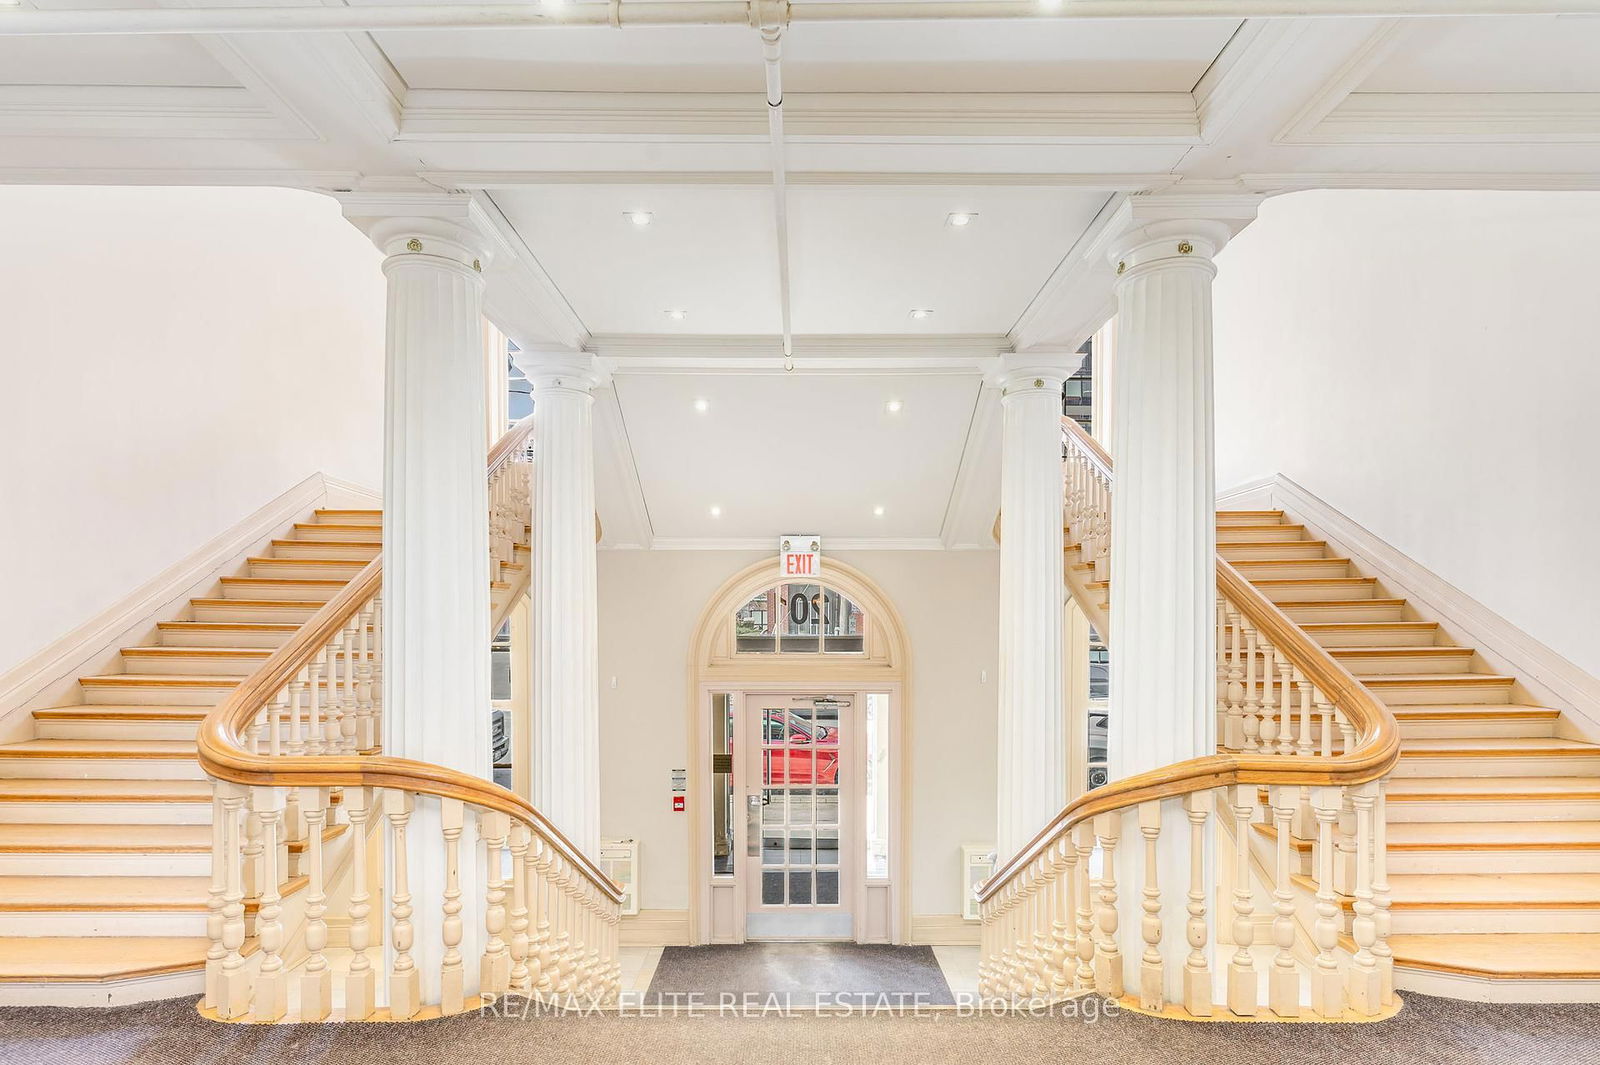
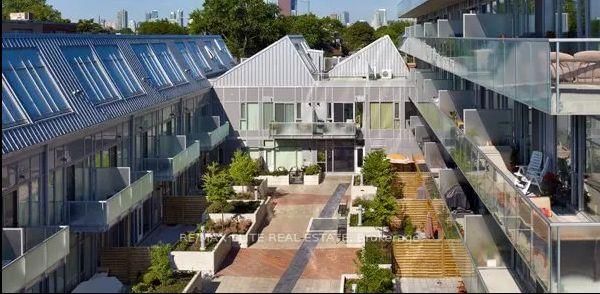
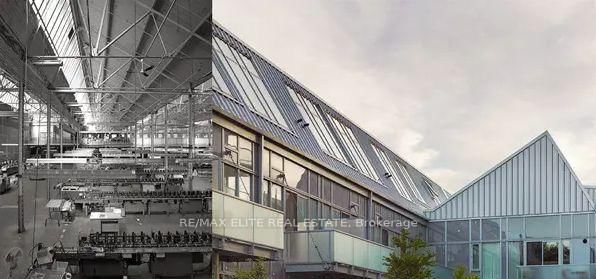
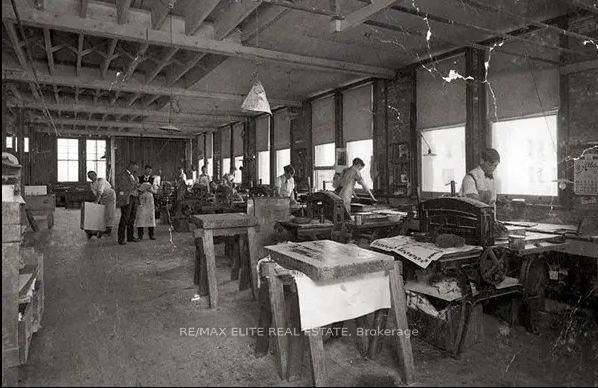
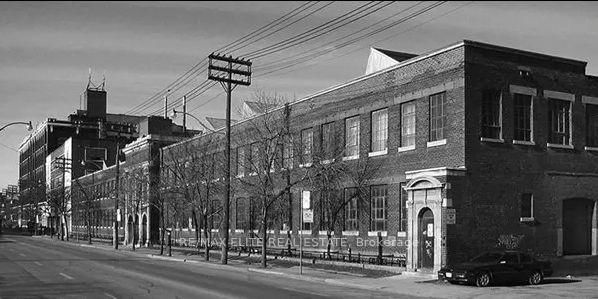
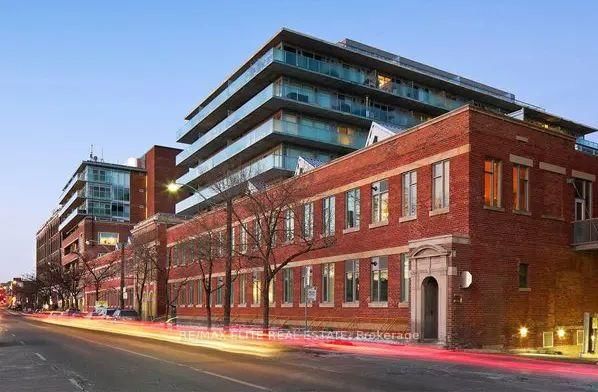
Rare Opportunity to Own a Stunning SW Corner Loft in Leslievilles Iconic 'Printing Factory Lofts'! Step into this sun-drenched, open-concept 2-bedroom loft, boasting 919 sq. ft. of interior space plus an expansive 345+ sq. ft. wrap-around terrace. Originally built in 1913 as a printing press and transformed into condos in 2010, this historic building seamlessly blends industrial charm with modern luxury. The loft features soaring 10 ft ceilings with exposed pipes, polished concrete floors, and dramatic floor-to-ceiling windows that flood the space with natural light. The coveted southwest exposure offers breathtaking views of the city skyline and adjacent park, creating a picture-perfect backdrop for your urban oasis. Both large bedrooms include ample closet space, floor-to-ceiling windows, and blackout curtains for restful nights. The open-concept living, dining, and kitchen area is designed for entertaining, complete with stainless steel appliances, granite countertops, a spacious island with a breakfast bar, and concrete pillars that add to the loft's edgy, industrial vibe.The wrap-around terrace is a rare gem perfect for morning coffee, sunset cocktails, or simply soaking in the panoramic views. Located in the heart of Leslieville, you'll have easy access to trendy cafes, shops, and vibrant community spaces. This loft is truly a unique blend of history, style, and urban convenience. Don't miss your chance to own this extraordinary space the perfect place to live, work, and entertain!
Appliances;S/S Fridge, Stove, Dishwasher, Microwave Rangehood, Stacked Washer&Dryer, Window Treatments, Elfs,
Foyer
Kitchen
Dining
Living
Primary
2nd Br
The graph below compares the average list price and average sale price of condos in this neighborhood by month for the last 24 months. When average sale price is greater than average list price, this may suggest a buyer's market. When average sale price is lower than the average list price this may suggest a seller's market.
The graph below illustrates the average days on market for condos in this neighborhood. The yellow area may indicate a buyer's market, the green area may indicate a balanced market and the red area may indicate a seller's market.
Sales Representative, Century 21 People’s Choice Realty Inc., Brokerage
(647) 576 - 2100
Toronto, Waterfront Communities C8, M5A 4E8
Toronto, Cabbagetown-South St. James Town, M5A 4K3
Toronto, Cabbagetown-South St. James Town, M5A 4K3
Toronto, Cabbagetown-South St. James Town, M5A 4K3
Toronto, North St. James Town, M4X 1L1
Toronto, North St. James Town, M4Y 2J3
Toronto, Church-Yonge Corridor, M5B 2P7